1. A decade of snakebites in Colombia: where are we now and where are we going?
During the last ten years (2010-2020) in Colombia about ~49,143 snakebite accidents have occurred, most of them taking place in rural environments (77%), with an annual average of 4,468.68 reported events, and an average per capita incidence of 9.27 events per 100000 persons (Figure 1A). As a result, among South American countries, Colombia ranks third in the number of snakebites per year and sixth in snakebite incidents per 100,000 inhabitants [1]. During this decade, snakebite accidents showed a total annual average growth of 14.72% with a cumulative variation of 1.38%, with 2018 and 2019 as the years with the highest snakebite events reported. This means that during the period 2010-2020 snakebites increased an average of 65.76 ±6.16 events per year.
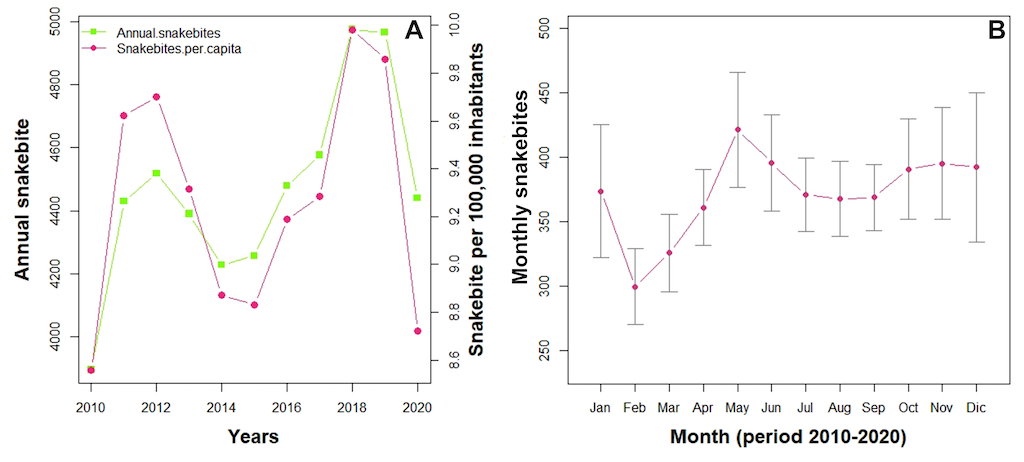
Figure 1. Snakebite incidence in Colombia. (A) Line chart depicting the variability of the absolute annual snakebite cases and snakebite incidence rate per 100,000 inhabitants during the period 2010-2020. (B) Line chart depicting the variability of absolute monthly snakebites cases per month during the period 2010-2020. Dots represent mean per month, and whiskers represent standard deviation (SE).
During the months of January, February, and March the lowest number of snakebite events were reported; and during May and November the highest number were reported (Figure 1B). This pattern coincides with the bimodal climate regimen of the Colombia regions that report the highest annual snakebites events (Figure 2) [2]. After performing a timeseries analysis including a seasonal and trend decomposition using loess (STL), which decompose timeseries in a series which capture trend and another one which captures seasonality, we found that there were two seasons with high risk, around April-June, and around October-December.
This corresponded to the bimodal rainfall pattern found in the Andean region of the country, that is more evident during this analysis in comparison with the description in Figure 1B. There is a conspicuously low risk season during January, corresponding to the marked dry season throughout the country. In Colombia, the nationally aggregated bimodal climate is characterized by two rainy seasons (April-June and October-November) and two dry seasons (mid-November to March and between July and mid-September).
So, annual snakebites at the national level suggest they are seasonal, with a major case reporting beginning in the rainy season and then decreasing at the end of the dry season. This relationship between incidence and rainfall has been deeply explored in Colombia by Bravo-Vega et al [3], where the authors show that dry seasons are the mechanisms behind snakebite incidence and rainfall association: Rainfall acts as a limiting resource, decreasing incidence during marked dry seasons. In addition, time-series analysis shows an interannual increase in cases between 2018 and 2020, that may correspond to the latest la Niña phenomena where average rainfall increases; and the decay shown in the trend after 2020 can be explained by the lockdown because of the COVID-19 pandemic [4,5]. Finally, the per capita snakebite incidence does not show a steady annual increase. Conversely, across the decade it exposes a heterogenous behavior, depicting two peaks in 2013 and 2019 (Figure 1), suggesting an interannual cyclical trend which can be associated with macroclimatic fluctuations such as el Niño and la Niña (Figure 2).
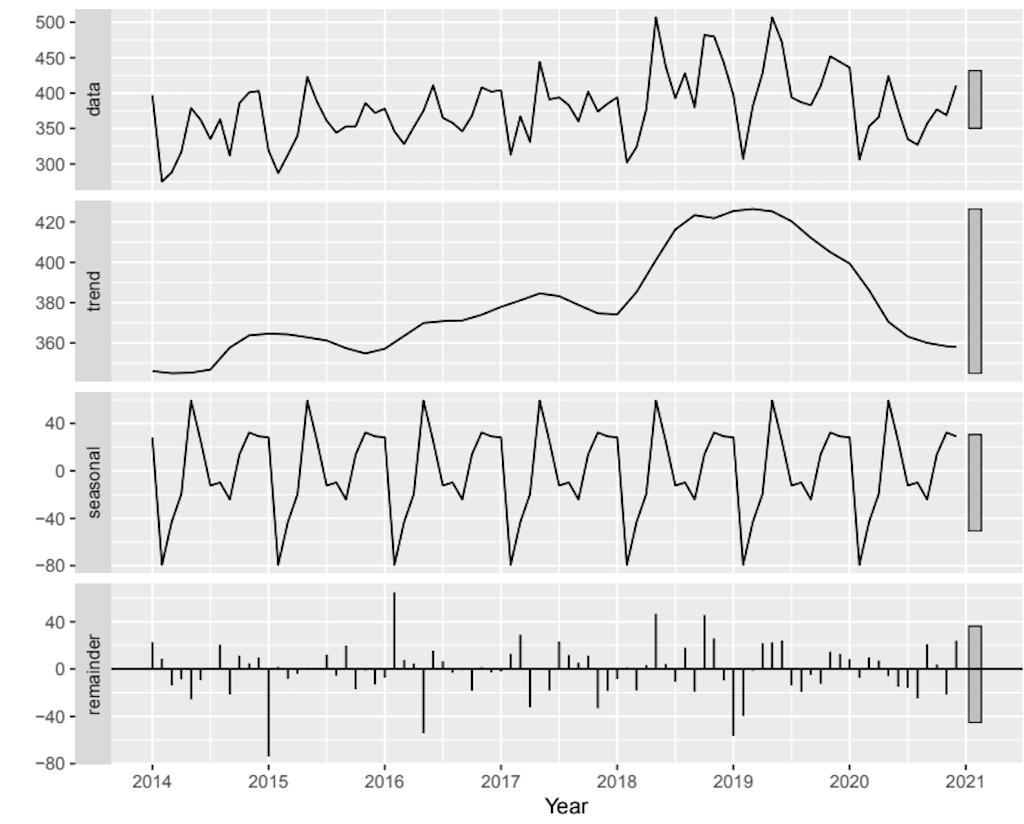
Figure 2. Seasonal and trend decomposition using loess (STL decomposition) of cases timeseries. We used monthly data and a frequency of data sampling = 12 to capture seasonal variation between months, thus capturing in the seasonal component intra-annual seasonality and the trend towards inter-annual variation. At the beginning of each year the seasonal component decreases conspicuously because of the marked dry season in the national aggregated rainfall. In addition, after 2018 the trend starts increasing until 2020, that corresponds to the latest La Niña phenomenon, and to the beginning of the COVID-19 pandemic.
1.1 Accumulative snakebite incidence in Colombia
The accumulated average of snakebite incidence has shown conspicuous inter-annual and intra-annual differences. Each timespan tends towards two different mathematical functions, indicating that they belong to different distributions, and exhibiting a distinctive behavior across time. Inter-annual snakebite incidence fits well with a saturation function (Fig. 3A, r2= 0.88, P<0.0001) with its residuals fitting a normal distribution (D = 0.17, P= 0.47), meaning that the entire model is also significant and well-supported. Therefore, the theorical annual snakebite incidence expected in Colombia is about 4,401 events per year. However, the uncertainty of the regression model is about 12%, meaning the annual snakebite incidence can range from 3,872 to 4,929 snakebite events, that agree with the variability observed across the decade assessed.

Figure 3. Theoretical predictions of snakebite incidence in Colombia. (A) Inter-annual snakebite incidence prediction by the saturation regression model. (B) Intra-annual snakebite incidence prediction by the rational regression model. Pink dots depict the annual and month cumulative average of snakebites. Black line depicts regression models.
The intra-annual snakebite incidence fits very well with a rational regression model (Fig. 3B, r2= 0.96, P<0.0001), but its residuals did not fit a normal distribution (D = 0.096, P= 0.004), indicating that the model is significant but not well-supported. This fact does not invalidate the model since its predictive capacities are high (high r2). However, its predictive power is constrained because the model cannot assure that the probability value shown is the correct one [6]. According to the rational regression model, the theoretical monthly snakebite incidence expected in Colombia is about 365.3 events per month with uncertainty ranging from 351 to 380 snakebite events per month. However, due to the poor fit of residuals, the monthly snakebite incidence predicted by the model may be close to 96% of real data.
Despite differences between inter or intra-annual snakebite incidences, as well as the constraints of mathematical predictions, both models conclude that the National Public Health Surveillance System (SIVIGILA, Spanish acronym) captures to a high degree (> 88% based on the analysis of the saturation function used to fit data) the completeness of the snakebite cases occurring during the last decade in the country. Thus, if the snakebite notification continues this tendency or it is enhanced for a short time, in a few years the reports could reach an asymptotic trend. This result can be seen as a national achievement whether during the timespan between 1975 to 1999 underreporting was huge with 70.8 cases per year, whilst before 2010 2,161 events per year were reported [7,8].
1.2 Spatial distribution of snakebites in Colombia
The geographically weighted regression (GWR) shows that bioclimatic and socioeconomic variables drive the spatial heterogeneity of the distribution of snakebite cases in Colombia (see appendix A and B for details). By dividing the incidence into urban and rural cases, the predictive capability of the model increases (Table 1). The difference between the R-squared of an ordinary multiple linear regression and the GWR is remarkable, thus the spatial structure of the cases plays an important role driving incidence.
Table 1. Results of snakebite incidence models
|
Population
|
R-squared*
|
GWR R-Squared
|
Explanatories variables
|
|
Total**
|
0.19
|
0.56
|
Population, NBI, B1, B4, B7, B12, B15, B19
|
|
Urban
|
0.05
|
0.53
|
Population, Human footprint index, B12, B18
|
|
Rural
|
0.36
|
0.67
|
Population, Human footprint index, B1, B4, B7, B12, B18, B19
|
*This value corresponds to a multiple linear model that does not account for spatial structure. B1, B4, B7, B12, B15, B18 and B19 correspond to bioclimatic variables obtained from the Worldclim server. (Appendix A and B for details). ** Total population means urban + rural populations in which snakebite incidence occurs
We calibrated models by using all variables, and with Akaike information criterion (AIC), that compensate the model’s predictive capacity by the number of parameters; and we selected the “best” model. The independent variables that explained better snakebite incidence changed between areas (Table 1), that may be related to the distinctive drivers of snakebite incidence affecting urban and rural populations. The precipitation (B12) and population were the only explanatories variables shared by urban, rural, and total (urban+rural) populations assessed. The distribution of the GWR coefficient for both variables can be seen in Figure 4. (The distribution for the other variables is shown in appendix, as well as cases at a municipality scale are shown in appendix B).
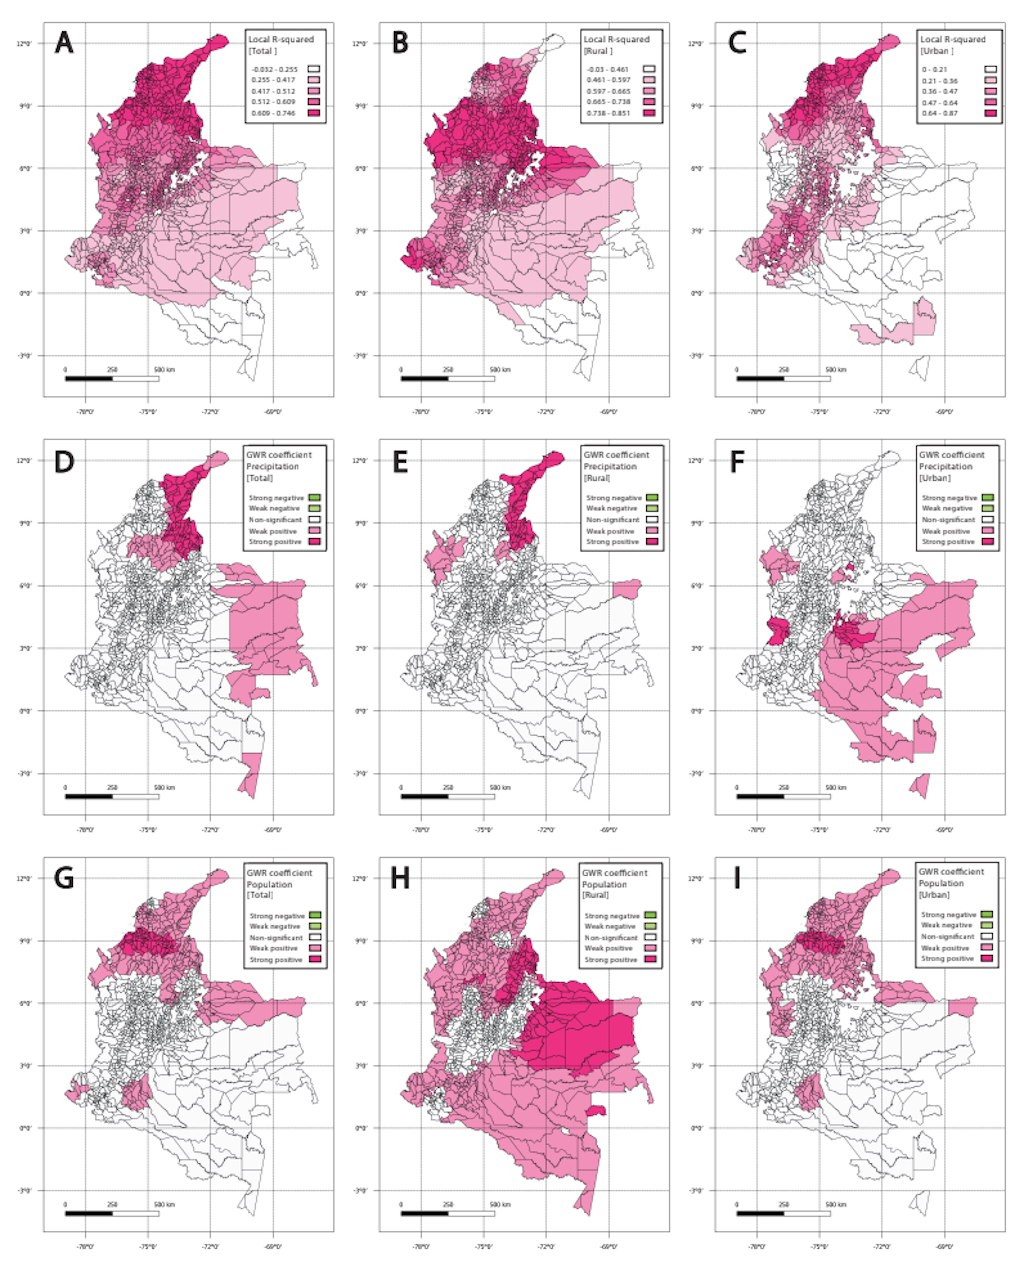
Figure 4. R-squared and GWR coefficients spatial distribution. (A-C) Local R-squared for the GWR model in the three populations (Total, Rural and Urban). Note the spatial variation of the values, where urban and total population adjust the Caribbean coast, but rural populations adjust better in the southern and northern Pacific, the middle Magdalena valley, and the northern Orinoco plains. (D-F) Illustrate GWR coefficient for precipitation. Note the differences between the spatial distribution, where for rural populations the precipitation strongly affects the incidence on the northern Caribbean coast and in the Catatumbo region, whilst it affects urban cases in most of the Orinoco and Amazonian region. (G-I) Depict GWR coefficient for the population. Note how the rural population drives the incidence in most of the country, whilst urban populations drive the incidence mostly in the northern Pacific and the Caribbean coast.
These differences underline the importance of analyzing discriminated data, because by using aggregated data several associations and important behaviors could be masked. For example, the human footprint does not drive total incidence, but it is important in the rural and urban incidence (see Figure S2 in appendix B). In fact, the coefficient is negative in rural cases, suggesting that an increase in this index will decrease the cases, but it is positive for urban cases. (Human footprint index = 0-100, where zero (0) indicates no human impact or footprint, and 100 indicates total human impact or footprint that has completely transformed the original ecosystem)
Thus, a complex relationship is behind the human footprint and snakebite, that may be explained by the spatial distribution of the coefficient. For urban populations, the positive association is mainly in Meta department, that encompasses Orinoco savannas. Due to its proximity to the country's capital, this department has experienced a rapid expansion of both urban and agricultural frontiers, leading to habitat loss for snakes. Consequently, this has reduced the likelihood of snakebite incidents within urban areas. However, it has simultaneously increased the frequency of snakebites in peri-urban zones where such frontier expansion is occurring. On the other hand, the negative association observed in rural areas located in the northern Pacific region, the middle Orinoco River basin, and the Amazon indicates that the probability of snakebite accidents increases when rural settlements are situated near or within natural snake habitats. This is further exacerbated by the exposure of farmers and rural workers to activities that directly disturb these habitats. Even so, this complex effect must be detailed to understand the association between anthropic intervention and snakebite incidence, and its relevance to public health.
1.3 Per capita snakebite incidence
Per capita snakebite incidence showed wide variability across Colombian departments and ecoregions (see https://ofidismo.ins.gov.co/). Despite the trans-Andean departments of Antioquia, Bolívar, Norte de Santander, and Cesar having the highest annual number of snakebites (Figure 5), the cis-Andean departments of Vaupés, Guaviare, Amazonas, Caquetá, Putumayo (Amazon ecoregion), Arauca, Vichada, and Casanare (Orinoquia ecoregion) exhibited the highest per capita incidence (Table 2).
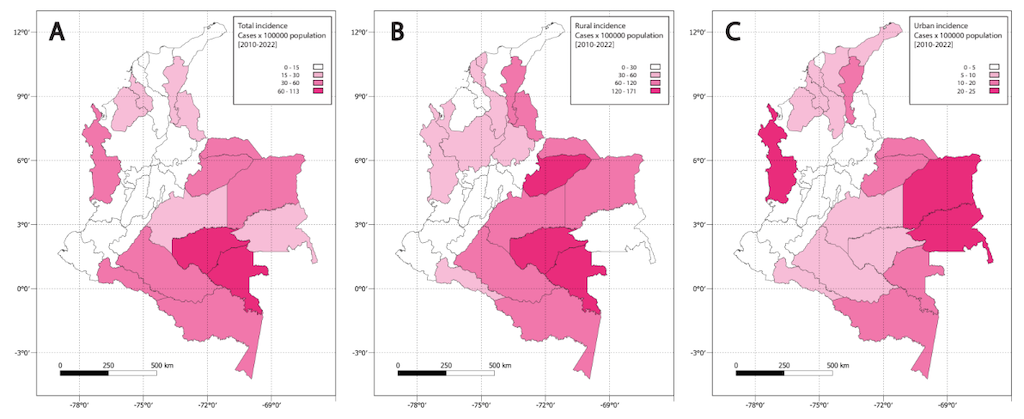
Figure 5. Incidence per 100,000 inhabitants during 2010-2020. (A) Total snakebite incidence. (B) Urban snakebite cases. (C) Rural snakebite incidence.
Table 2. Snakebite incidence per 100,000 inhabitants (2010-2020) divided by rural, urban, and total (rural+urban) populations inhabiting Colombian territorial entities.
|
Department
|
Mean per capita rural incidence
|
Mean per capita urban incidence
|
Mean per capita total
|
|
Amazonas
|
82.8
|
19.5
|
59.7
|
|
Antioquia
|
37.1
|
1.5
|
9.3
|
|
Arauca
|
101.9
|
12.1
|
45.4
|
|
Atlántico
|
38.1
|
3.8
|
5.3
|
|
Bogotá D.C
|
1.1
|
0.0
|
<0.001
|
|
Bolívar
|
39.3
|
6.3
|
13.8
|
|
Boyacá
|
12.0
|
0.7
|
5.5
|
|
Caldas
|
18.3
|
1.2
|
6.0
|
|
Caquetá
|
67.6
|
9.2
|
33.0
|
|
Casanare
|
133.5
|
11.9
|
43.8
|
|
Cauca
|
11.8
|
2.6
|
8.2
|
|
Cesar
|
66.7
|
12.5
|
26.3
|
|
Choco
|
50.4
|
24.0
|
37.5
|
|
Córdoba
|
25.5
|
6.4
|
15.4
|
|
Cundinamarca
|
6.1
|
0.5
|
2.3
|
|
Guainía
|
29.6
|
23.4
|
27.8
|
|
La Guajira
|
17.4
|
5.5
|
10.9
|
|
Guaviare
|
164.6
|
5.7
|
71.6
|
|
Huila
|
24.5
|
2.2
|
11.1
|
|
Magdalena
|
28.6
|
8.3
|
13.7
|
|
Meta
|
81.5
|
7.8
|
25.7
|
|
Nariño
|
10.3
|
1.7
|
11.1
|
|
Norte Santander
|
84.3
|
4.6
|
16.8
|
|
Putumayo
|
58.6
|
8.8
|
34.4
|
|
Quindío
|
7.3
|
0.8
|
1.6
|
|
Risaralda
|
17.9
|
0.7
|
4.4
|
|
San Andrés archipelago
|
0.0
|
1.8
|
1.3
|
|
Santander
|
30.8
|
2.3
|
9.3
|
|
Sucre
|
27.0
|
9.7
|
15.4
|
|
Tolima
|
16.7
|
2.4
|
6.9
|
|
Valle del Cauca
|
10.1
|
0.7
|
1.9
|
|
Vaupés
|
170.2
|
19.1
|
111.9
|
|
Vichada
|
70.3
|
23.6
|
50.0
|
|
Mean
|
46.7
|
7.3
|
22.3
|
|
National per capita incidence
|
|
|
9.3
|
|
National to split population Ratio
|
5.0
|
0.78
|
2.4
|
All per capita incidences for each department are of the annual average of the per capita incidences during the period 2010-2020. The national per capita incidence was calculated based on the national population per 100,000 inhabitants during the period 2010-2020.
The cis-Andean departments share the lowest human population in the country mainly living in rural areas (~60-63%) rather than urban settlements (~37-40%) and having close interaction with intact forest landscapes [9]. Hence, in a demographic sense, these departments depict an opposite pattern to that observed at the national level in which ~70% of Colombians live in urban settlements rather than rural areas [9,10]. This fact, in addition to the snakebite occurrence described above, highlights the Colombian rural population as the highest vulnerability for snakebite accidents.
Nevertheless, as global a standard, in the Colombian epidemiological surveillance system the per capita snakebite incidence is calculated based on the total population per 100,000 inhabitants rather than considering rural and urban populations separately [11,12]. Given that in Colombia most snakebite envenomation patients live in rural environments, calculating the per capita snakebite incidence following the global standard raises significant bias about the real snakebite incidence in the country.
Previous assessments in Colombia have employed the standard measurement of incidence, with some misunderstanding the data, and reporting a per capita snakebite incidence ranging from 6.3 events for lowest populated localities to 20 events in the most populated departments or municipalities [13,14]. Others underestimate the incidence per department or ecoregion since rural and urban populations were not considered separately [15]. After analyzing snakebite events during the period 2010-2020, we found a significant differences in the per capita snakebite incidence between rural and urban populations (Figure 6; H (2) = 325, P < 0.0001). Indeed, rural population was two to three-fold higher than the total and urban per capita snakebite incidence. Moreover, the per capita snakebite incidence by department ranged 0–170.2 (x̄ = 46.7) events for rural populations, 0–24 (x̄ = 7.3) for urban populations, to 0-11.2 (x̄ = 22.3) events in the total departmental population.
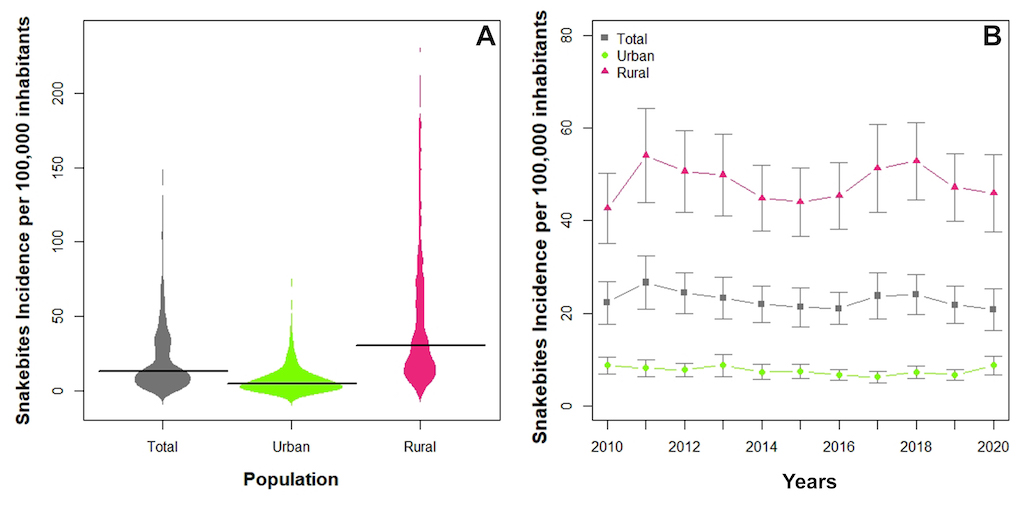
Figure 6. Comparisons of per capita snakebite incidence between rural, urban, and total department (standard calculus) populations clustering by years. (A) Bean plot depicting the per capita snakebite incidence distribution by population. The bold horizontal line depicts median. (B) Line chart depicts per capita snakebite incidence by population across timespan studied (2010-2020). Symbols represent mean and whiskers show the standard error (SE).
The average rural per capita snakebite incidence is five-fold the national per capita incidence reported by previous assessments [9.3 events; 13–16]. These results indicate that the standard measurements underestimate the impact of the annual snakebites in vulnerable rural populations. Furthermore, the standard incidence measurement masks the association between occupational, environmental, or behavioral factors that could be impacting snakebite accidents due to the lack of differentiation between the areas in which the accidents occur.
An accurate estimation of the annual per capita snakebite incidence is of paramount importance to improve the prevention of snakebites and to control the incidence [11]. Therefore, we recommend calculating the per capita snakebite incidence, considering rural and urban populations separately. In this fashion, epidemiological interventions and strategies that seek to mitigate and prevent snakebite accidents can be addressed based on a better understanding of the incidence.
One of the most serious constraints in the estimation of the incidence of snakebites is robust data acquisition. Snakebite epidemiological surveillance of developing countries like Colombia frequently have significant shortfalls due to the lack of resources, trained health staff, or technological infrastructure. However, since 2004 when snakebite was included in the SIVIGILA as a mandatory report [13], continuous improvements have been made to accelerate the learning curve, as well as to enhance the national epidemiological strategy [8,18]. Currently, the growing number of snakebite accidents reported between 2010-2020 reflect the past efforts to improve the Colombian epidemiological surveillance strategy. Additionally, throughout the decade studied, a total of 26 atypical values of per capita snakebite incidence were observed in the departments of Vaupés, Guaviare, Casanare, and Atlántico. These snakebite events were negatively associated with time (R 2= -0.67, P= 0.025), indicating that as the snakebite notification system improved its data acquisition, extreme values dropped.
Nevertheless, due to large and isolated rural populations in Colombia and their limited access to the national health system [19], currently, SIVIGILA continues having a significant underestimation of snakebite incidence. Even though epidemiological data gathered via medical records is the most cost-effective way to obtain reliable data [20], several socio-demographic biases (e.g., patient seeking for traditional healers, or low family income) constrain the accurate account of annual total snakebite events reported. To overcome these difficulties for estimating accurate snakebite incidence and to reduce uncertainties due underreporting, mathematical models have been proposed that can estimate the geographic patterns of snakebite incidence, as well as the underreporting [20].
Particularly in Colombia, recent research has developed a Bayesian estimation framework, using a generalized linear mixed effect model based on theoretical models to estimate snakebite events underreported in the country [21]. This tool focuses on snakebites of Bothrops asper (Common lancehead pitviper) and B. atrox (Mapanaré), the two most medically important venomous snake species in the country that cause ~62% of the snakebite events [14,22,23]. This research estimated that around 10% of the total cases are not reported, so around 447 cases are not reported yearly. This number can be considered as small but given that mortality and morbidity will increase in these cases the absence of medical attention, amputations and deaths will be underestimated.
These models showed that the Orinoco and Amazonian basin (cis-Andean region) share the highest snakebite risk and the highest underreporting in the country. These results agree with per capita incidence assessments discussed above, as well as high rural per capita incidence observed in the Colombian departments located in the cis-Andean region (Table 2). Further, these models show that the higher snakebite risk values and reported incidence tend to cluster in deprived populations located in departments characterized by low population densities, low coverage of road infrastructure, presence of indigenous populations, low urbanization, and in which B. atrox is distributed (cis-Andean region).
Therefore, despite most of the annual envenomation reports in Colombia coming from the Antioquia department and Caribbean region (trans-Andean region), that are densely populated and where B. asper is distributed, the people living in departments located in the cis-Andean region in which B. atrox is distributed are more prone to suffer a snakebite.
Statistical inference models rise as an effective and cost-effective way to estimate the snakebite burden in tropical countries like Colombia, constrained by sociodemographic and infrastructure factors. Nevertheless, mathematical models cannot replace the incidence data gathered via medical records since they have limitations, as explained below.
Data sampling.— Most species occurrence data is based only on species presence records, causing bias in the niche or distribution models (see https://ofidismo.ins.gov.co/). As most of the tropical areas and species, Colombian snake species lack large sets of data including both presence and absence. Hence, niche or distribution models commonly exhibit strong spatial biases in survey efforts, causing in most cases spatial autocorrelation [24,25]. This bias can have a deep impact on the spatial correlation between eco-epidemiological variables, as well as on the quality of the model that seeks to explain the variability of the snakebite incidence. Therefore, species occurrence models based on presence-only data must be carefully employed by users, and statistical adjustment must be carried out to obtain the “best” model possible [24].
Exposure of population assumptions.— In Andean tropical countries like Colombia, several municipalities have cities and towns located at high elevations where nobody or very few venomous snakes are found, but the incidence is calculated by clustering the cases by municipality without considering the elevational gradient in which snakebite events occur. This causes a serious bias in the correlation between the geographic distribution of snakebite incidence and snake species distributions, as well as in the correlation with environmental variables associated with the dynamics of snakebite envenomation [21].
Sympatric species and crypticity.— In Colombia, like most of the mega-diverse tropical countries worldwide, several species share and overlap their distributions (see Chapter 1). Hence, closely related or species resembling each other can generate bias in taxonomic species identification during the procedure of filing medical reports. Particularly, due to the difficulties of taxonomic species identification, the Colombian notification snakebite sheet only identifies most of the genera of venomous snakes (e.g., Bothrocophias genus is missing), but not species when snakebite is reported.
Hence, despite snakebite accidents being caused by species-specific negative interactions, SIVIGILA cannot directly detect the involved species. The misidentification of snake species generates significant bias for snakebite frequencies, as well as in the total number of snakebites per species. Furthermore, due to the parameter of models defining the probability that an encounter with a snake species causes a bite must be calibrated, when snakebite is caused by multiple species, it is necessary to perform a multiple linear regression based on measured encounter frequency for each species separately [20].
Despite their limitations, mathematical models are powerful predictive tools when used synergistically with data collected by epidemiological surveillance systems like SIVIGILA, helping to determine the snakebite incidence at local, regional, and national levels, as well as the real demand of antivenom, and selecting important epidemiological parameters and factors underlying the snakebite eco-epidemiology [14,20,26].
1.4 Snakebite demography
As expected, in Colombia men are significantly more prone to suffer snakebite than women (t (12.05) = -23.68, P < 0.0001), with a female to male annual ratio of snake-bitten victims of 1: 2.3–2.7. This pattern agrees with the general accident rate pattern by gender observed in the Americas due to the cultural labors done in rural environments, as well as the patterns observed in developing countries [1,27]. In both genders, most of snakebites occur in young people who range 12-29 years old and that comprise the labor force in rural areas (Figure 7A). However, snakebites in Colombia occurs from early years (infants of 0.5-5 years old) to elder ages (elders of 85-110) and are frequent in infants (~4.0%) and infrequent in elders (< 1%).
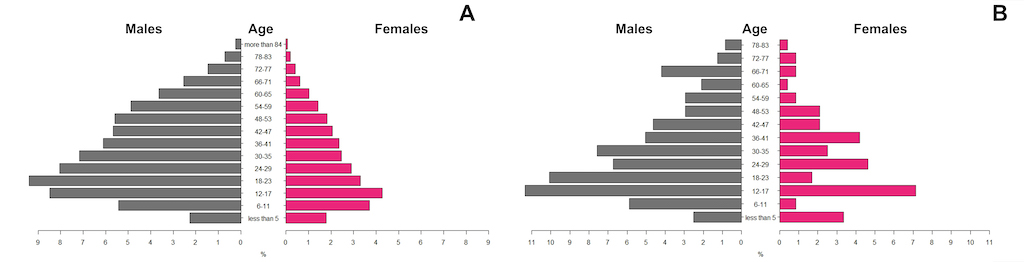
Figure 7. Snakebite accident distribution per age rank. (A) Pyramid plot depicting the age rank distribution of snakebite accidents in the Colombian population during the period 2010-2020. (B) Pyramid plot depicting the age rank distribution of snakebite accidents of the foreigner population that received medical care in theColombian health institutions during the period 2010-2020.
During the period 2010-2020, 239 foreign persons received medical care in Colombian health institutions due snakebite. Snakebite events followed a similar pattern by gender observed in the Colombia population. Most snakebites occurred in young people ranging from 12-29 years old (Figure 7). However, in the foreigner population there was a marked heterogeneity within the female age-ranks, in which women of middle age (38–55-year-old) were prone to suffer snakebite (Figure 7B).
A detailed revision of snakebites of the Colombian social-vulnerable populations showed that among ethnic groups present in the country, indigenous and afro-Colombian populations cluster 97% of the snakebites (N= 8,888 events), the highest frequency of snakebites is found in the Indigenous population (53%) as compared to afro-Colombians (44%) populations. Moreover, infants have an annual incidence average of 178.7 bites per year and are bitten mainly in rural environments (74%). The infants belong to communities of farmers with no ethnicity declared (78%) and to indigenous (14%) and afro-Colombian (8%) communities. In contrast, about 4% of the total snakebites reported in the last decade were suffered by the remaining social-vulnerable populations: handicapped, displaced, migrants, prisoners, pregnant, Indigents, orphans, community mothers, demobilized, psychiatric patients, and violence victims.
Most of the snakebites in the country occurred in persons belonging to socioeconomic strata 1 and 2, clustering respectively about 84% and 15 % of total snakebites in the country. Nevertheless, these proportions may be underestimated or have biases because around 75% of the snakebite notification records lacked socioeconomic strata assignments. The houses or properties of strata 1 and 2 represent the lowest socioeconomic strata in the country [28], meaning that the people live in homes with the lowest resources and livelihoods carry the most burden of snakebites in Colombia.
Most of the snakebite accidents encompassed during the period 2010-2020 (~49,143 events) were persons that belong to subsidized health schemes (71.5%), or they were uninsured (11.6%), while the remaining 16.9% were persons belonging to contributing health scheme (14.5%), or specials or excepted health schemes (1.9%; soldiers, police, and other occupations). This means that, in addition to the burden carried by low-income population living in rural areas, snakebite accidents represent a significant load on the national health system because most affected persons belong to subsidized schemes.
Regrettably, all these trends described above have not changed from the national evaluation of snakebite incidence made in 2010 [14], indicating that national efforts made in the last decade to reduce the snakebite accidents in Colombia and its burden on deprived populations and the health system, have not had a relevant impact. Therefore, the Colombian government must continue strengthening and enhancing its public health strategies to face snakebite accidents because it remains a neglected tropical disease.
2. The clinical picture of snakebite envenomation in Colombia
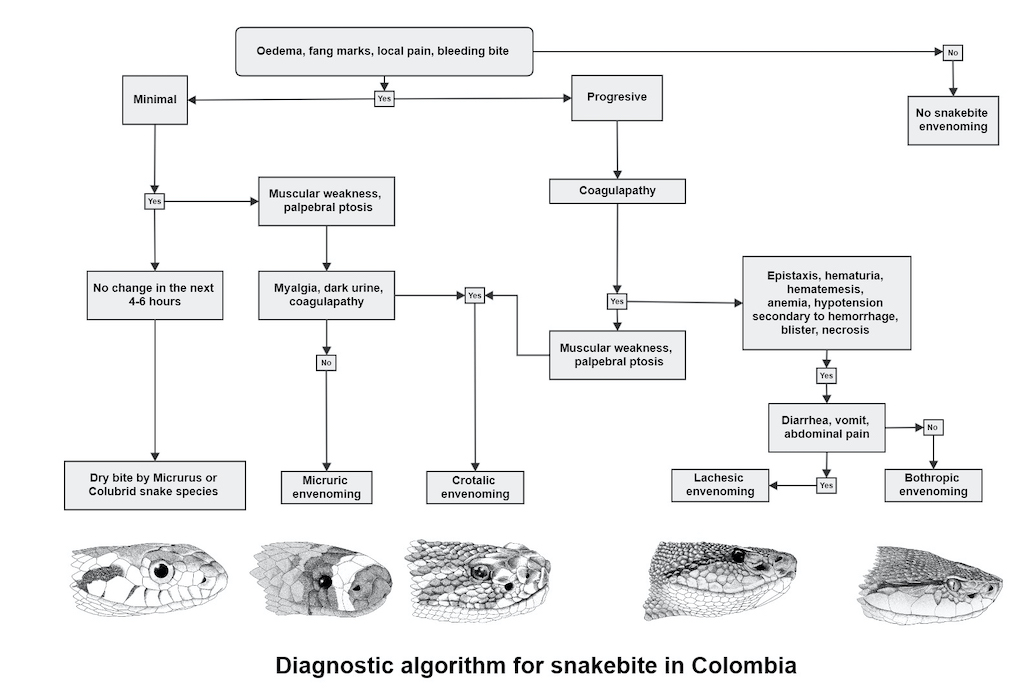
After analyzing SIVIGILA information regarding snakebite symptomatology between 2010 and 2020, we found that most bites were caused by snakes from the family Viperidae. Snakebite cases caused by species of the genera Bothrops, Bothriechis, and Porthidium were grouped under the category of bothropic envenomation (62%, Table 3). In all types of envenomation, mild envenomation represents 56-60 % of the total cases reported by SIVIGILA, while severe cases represent 6.4-10%, (Table 4). We propose a general algorithm for the diagnose of the type of envenomation in Colombia based on snakebite patient symptomatology (Figure 8).
Table 3. Frequency of the type of snake envenomation reported in Colombia by SIVIGILA during 2010-2020.
|
Envenomation type
|
Number of cases reported during 2010-2020
|
%
|
|
Pitvipers
|
|
|
|
Bothropic
|
30,528
|
62.4
|
|
Crotalic
|
1,317
|
2.7
|
|
Lachesic
|
254
|
0.5
|
|
Elapids
|
|
|
|
Micruric
|
601
|
1.2
|
|
Hydrophic
|
65
|
0.1
|
|
Colubrids
|
345
|
0.7
|
|
Other
|
3,004
|
6.1
|
|
Not identified
|
1,2821
|
26.2
|
|
Total
|
48,935
|
100
|
Table 4. Envenomation type and severity frequency reported during 2010-2020.
|
Severity
|
Bothropic
|
%
|
Crotalic
|
|
%
|
Lachesic
|
%
|
Micruric
|
%
|
|
Mild
|
767
|
58.2
|
767
|
|
58.2
|
135
|
53.1
|
380
|
63.2
|
|
Moderate
|
461
|
35
|
461
|
|
35
|
73
|
28.7
|
157
|
26.1
|
|
Severe
|
89
|
6.8
|
89
|
|
6.7
|
46
|
18.1
|
64
|
10.6
|
Bothropic: Envenomations caused by species of the genera Bothrops, Bothriechis, Bothrocophias and Porthidium. Crotalic: Envenomations caused by Crotalus durissus.Lachesic: Envenomations caused by Lachesis acrochorda and L. muta.Micruric:Envenomations caused by species of the genus Micrurus.
2.1 Envenomation caused by pit viper snakes
Bothropic envenomation
Snake venom from the genera Bothriechis, Bothrocophias, Bothrops and Porthidium have toxins that together cause similar symptomatology, making it possible to clinically cluster their envenomation under a single category named bothropic envenomation. Some of these toxins are phospholipase A2, metalloproteinases, serine proteases, and l-amino acid oxidases, which affect coagulation, destroy tissues, and promote inflammation [29] (See Chapter 5). According to SIVIGILA data for 2010-2020 the most frequent local symptoms are fang marks, pain, edema, and erythema, occurring in 91.6%, 90.9%, 85.4% and 38.4% of the cases (Table 5)
Table 5. Local symptoms caused by pit viper snakebites.
|
Bothropic cases
|
%
|
Crotalic cases
|
%
|
Lachesic cases
|
%
|
|
Total cases
|
30,528
|
|
254
|
|
1,317
|
|
|
Symptoms
|
|
Fang marks
|
27,986
|
91.6
|
222
|
87.4
|
1,010
|
76.6
|
|
Pain
|
27,762
|
90.9
|
222
|
87.4
|
1,042
|
79.1
|
|
Oedema
|
26,091
|
85.4
|
199
|
78.3
|
1,113
|
84.5
|
|
Erythema
|
11,730
|
38.4
|
100
|
39.3
|
533
|
40.4
|
|
Equímosis
|
47,98
|
15.7
|
40
|
15.7
|
147
|
11.1
|
|
Blisters
|
1,949
|
6.3
|
23
|
9
|
76
|
5.7
|
|
Necrosis
|
688
|
2.2
|
6
|
2.4
|
23
|
1.7
|
Bothropic: Envenomations caused by species of the genera Bothrops, Bothriechis, Bothrocophias and Porthidium. Crotalic: Envenomations caused by Crotalus durissus. Lachesic:Envenomations caused by Lachesis acrochorda and L. muta.
At least 21.7% of patients had systemic symptoms. The venom of these snakes typically causes symptoms of anticoagulation, such as disseminated intravascular coagulation (DIC), epistaxis, hematuria, hematochezia, hematemesis, anemia, hypotension secondary to hemorrhage or third spacing; but the incidence of these symptoms in the last decade was low. Each one of these symptoms occurred in less than 5% of the patients. The most common hemotoxic symptom was gingival bleeding, representing 6.2% of the cases. Another important systemic symptom was acute kidney failure, that was present in 1.02% of cases (312 cases). Finally, necrosis and compartmental syndrome, associated with local severity, only occurred in 2.25% and 0.75% of the cases. Additionally, the most common infectious symptoms were cellulitis (20.6%), and abscesses (3.26%). Table 6 shows the specific results for each type of envenoming.
Table 6. Frequency of systemic symptoms by viperid envenomation according to SIVIGILA during 2010-2020
|
Systemic symptoms
|
Bothropic
|
%
|
Lachesic
|
%
|
Crotalic
|
%
|
|
Nausea
|
8,462
|
27.7
|
70
|
27.6
|
361
|
27.4
|
|
Vomit
|
4,690
|
15.4
|
42
|
16.5
|
207
|
15.7
|
|
Sialorrhea
|
764
|
2.5
|
7
|
2.8
|
40
|
3.0
|
|
Diarrhea
|
421
|
1.4
|
7
|
2.8
|
16
|
1.2
|
|
Bradycardia
|
474
|
1.5
|
9
|
3.5
|
20
|
1.5
|
|
Hypotension
|
1,091
|
3.6
|
12
|
4.7
|
43
|
3.3
|
|
Abdominal pain
|
1,640
|
5.4
|
22
|
8.7
|
70
|
5.3
|
|
Neurological facies
|
198
|
0.6
|
2
|
0.8
|
18
|
1.4
|
|
Visual disturbance
|
490
|
1.6
|
6
|
2.4
|
26
|
2.0
|
|
Sensory disturbance
|
348
|
1.1
|
4
|
1.6
|
16
|
1.2
|
|
Muscular weakness
|
2,506
|
8.2
|
20
|
7.9
|
114
|
8.7
|
|
Oliguria
|
463
|
1.5
|
4
|
1.6
|
15
|
1.1
|
|
Cyanosis
|
305
|
1.0
|
4
|
1.6
|
13
|
1.0
|
|
Epistaxis
|
354
|
1.2
|
219
|
86.2
|
12
|
0.9
|
|
Gingival bleeding
|
902
|
6.2
|
17
|
6.7
|
46
|
3.5
|
|
Hematemesis
|
836
|
2.7
|
10
|
3.9
|
22
|
1.7
|
|
Hematuria
|
693
|
2.3
|
6
|
2.4
|
27
|
2.0
|
|
Hematochezia
|
102
|
0.3
|
1
|
0.4
|
4
|
0.3
|
|
Vertigo
|
1,564
|
5.1
|
10
|
3.9
|
68
|
5.2
|
|
Eyelid ptosis
|
74
|
0.2
|
1
|
0.4
|
9
|
0.7
|
|
Speech difficulty
|
409
|
1.3
|
5
|
2.0
|
24
|
1.8
|
|
Dysphagia
|
111
|
0.4
|
0
|
0
|
9
|
0.7
|
|
Cellulitis
|
6,294
|
20.6
|
47
|
18.5
|
277
|
21.0
|
|
Abscess
|
997
|
3.3
|
3
|
1.2
|
46
|
3.5
|
|
Necrosis
|
688
|
2.2
|
6
|
2.4
|
23
|
1.7
|
|
Myonecrosis
|
122
|
0.4
|
1
|
0.4
|
5
|
0.4
|
|
Fasciitis
|
224
|
0.7
|
4
|
1.6
|
3
|
0.2
|
|
Circulatory disorders
|
648
|
2.1
|
7
|
2.8
|
27
|
2.0
|
|
Compartment syndrome
|
228
|
0.7
|
3
|
1.2
|
10
|
0.8
|
|
Anemia
|
393
|
1.3
|
4
|
1.6
|
9
|
0.7
|
|
Hypovolemic shock
|
250
|
0.8
|
6
|
2.4
|
14
|
1.0
|
|
Septic shock
|
146
|
0.5
|
1
|
0.4
|
3
|
0.2
|
|
Acute respiratory infection
|
312
|
1.0
|
6
|
2.4
|
8
|
0.6
|
|
Disseminated intravascular coagulation
|
188
|
0.6
|
3
|
1.2
|
3
|
0.2
|
|
Subarachnoid hemorrhage
|
99
|
0.3
|
2
|
0.8
|
1
|
0.1
|
|
Cerebral edema
|
99
|
0.3
|
2
|
0.8
|
7
|
0.5
|
|
Ventilatory failure
|
173
|
0.6
|
4
|
1.6
|
18
|
1.4
|
|
Coma
|
58
|
0.2
|
0
|
0
|
1
|
0.1
|
|
Death
|
249
|
0.8
|
4
|
1.6
|
7
|
0.5
|
|
Septic shock
|
6,294
|
20.6
|
47
|
18.5
|
277
|
21.0
|
N: Number of cases reported by SIVIGILA
Lachesic envenomation
The symptoms for this envenomation are like bothropic envenomation, but its severity is stronger due to the large amounts of venom injected by Lachesis species, as well as given the cholinergic nature of the venom. Typical symptoms of envenomation are bradycardia, diarrhea, and hypotension [22]. The percentage of cases caused by Lachesis between 2010-2020, was 0.5%; only 18% of these accidents were classified as severe. Besides, 55% of the bites were in the lower limbs, 38% were in the upper limbs and the rest in other locations. The most frequent manifestations were visible fang marks (87.4%), pain (87.4%), epistaxis (86.2%), and edema (78.3%). Others, such as hypotension, bradycardia, and diarrhea, were reported in only 4.7%, 3.5%, and 2.7%, respectively. The most frequent type of local infection was cellulitis, which was reported in 18.5% of the cases (Table 5 and 6).
Crotalic envenomation
In Colombian, crotalic envenomation is caused by Crotalus durissus and is characterized by the typical coagulopathy symptoms observed in snakebites caused by species of the Viperidae family. However, local symptoms are less critical than those present in bothropic and lachesic envenomation. Crotalic envenomation have singular symptoms such as rhabdomyolysis, dark urine. secondary kidney failure, and neuromuscular paralysis, that are considered as characteristics of crotalic bites [22].
Throughout the assessed period from 2010 to 2020, crotalic envenomation demonstrated rare hemorrhagic manifestations, occurring in fewer than 4% of patients. Neurotoxic effects such as ventilatory failure, palpebral ptosis, slurred speech, or neurotoxic facies were described in less than 2% of the patients; and muscle weakness showed up in 8.6% of the cases. Those related to rhabdomyolysis and secondary renal failure occurred in less than 1% of cases. The most frequent type of local infection was cellulitis reported in 21% of cases (Table 6).
The percentage of cases of crotalic envenomation throughout the last decade were 2.7%, of which 56% were in the lower limbs, 31% in the upper limbs, and the rest in other parts of the body. The most frequent manifestations in this type of envenomation were local: edema (84.5%), pain (79.1%), fang marks (76.6%), and erythema (40.4%). In addition, ecchymosis, blisters, and necrosis were described in 11%, 5.7%, and 1.7% of cases (Table 5).
2.2
Envenomation caused by elapids
Micruric and Hydrophic envenomation
The venom of New World elapids is neurotoxic. These toxins affect the functioning of the neuromuscular junction both at the pre- and post-synaptic level (see Chapter 5). The clinical picture of neurotoxic envenomation is characterized by muscle weakness that is initially seen in the smallest muscles (eyelids, oculomotor muscles, phonation, and swallowing), progressing to larger muscle groups until it leads to respiratory failure and death in few hours [30].
About 63% of the cases of neurotoxic envenomation corresponded to mild envenomation (only local manifestations), 26% moderate and 10% severe; 50% of the envenomations was in the lower limbs; and 38% was in the upper limbs. Bites on finger and toes occurred in 6% and 3% of the cases, respectively. Body areas that traditionally have been considered unlikely for a Micrurus snakebite due to the size and limited capacity of the snake’s mouth to open (such as the head, neck, thorax, back and abdomen; see Chapter 5), occurred in less than 1% of the cases.
In neurotoxic envenomation the local symptoms are scarce, but according to the SIVIGILA data, in more than 75% of the cases, there were findings such as fang marks (78.9%) and pain (80.9%), while less than 5% of the cases showed characteristic symptoms such as slurred speech, palpebral ptosis, visual disturbances, sialorrhea, dysphagia, neurotoxic facies, and ventilatory failure (Table 7). Slurred speech, muscle weakness, drooling, dysphagia, and visual disturbances were the most frequent manifestations in moderate poisoning, and ventilatory failure occurred in severe cases (91%) (Table 8).
Table 7. Distribution of symptom frequencies caused by Micrurus sp. envenomings during 2010-2020.
|
Symptoms
|
Number of cases reported during 2010-2020
|
%
|
|
Fang marks
|
474
|
78.9
|
|
Pain
|
486
|
80.9
|
|
Oedema
|
350
|
58.2
|
|
Erythema
|
244
|
40.6
|
|
Nausea
|
168
|
27.9
|
|
Paresthesia
|
156
|
26.0
|
|
Muscular weakness
|
79
|
13.1
|
|
Vomit
|
59
|
9.8
|
|
Sialorrhea
|
24
|
4.0
|
|
Vertigo
|
31
|
5.2
|
|
Slurred speech
|
27
|
4.5
|
|
Palpebral ptosis
|
25
|
4.2
|
|
Ventilatory failure
|
22
|
3.7
|
|
Dysphagia
|
12
|
2.0
|
|
Neurotoxic facies
|
22
|
3.7
|
|
Blisters
|
11
|
1.8
|
|
Gingival bleeding
|
6
|
1.0
|
|
Epistaxis
|
3
|
0.5
|
|
Visual disturbance
|
28
|
4.7
|
|
Sensory disturbance
|
23
|
3.8
|
Total cases reported by SIVIGILA (2010-2020) = 601
Table 8. Distribution of systemic symptom frequencies caused by Micrurus sp. Envenomings divided by severity during 2010-2020.
|
Moderate
|
Severe
|
|
Symptoms
|
Cases reported
|
%
|
Cases reported
|
%
|
|
Paresthesia
|
42
|
26.9
|
23
|
14.7
|
|
Muscular weakness
|
32
|
40.5
|
23
|
29.1
|
|
Vomit
|
32
|
54.2
|
14
|
23.7
|
|
Sialorrhea
|
10
|
41.67
|
11
|
45.8
|
|
Vertigo
|
10
|
32.3
|
2
|
6.4
|
|
Slurred speech
|
13
|
48.1
|
12
|
44.4
|
|
Palpebral ptosis
|
9
|
36
|
14
|
56
|
|
Ventilatory failure
|
2
|
9.1
|
20
|
90.9
|
|
Dysphagia
|
5
|
41.7
|
6
|
50
|
|
Visual disturbance
|
12
|
42.9
|
7
|
25
|
|
Sensory disturbance
|
6
|
26.1
|
9
|
39.1
|
|
Neurotoxic facies
|
7
|
31.8
|
14
|
63.6
|
In 131 cases (21 %) the common name of the snake was related to pit vipers rather than coral snakes. Thus, it is highly possible that symptoms such as gingival bleeding, epistaxis and blisters were reported in the SIVIGILA form, given the species likely misidentification. Even so, coral snake’ venom does have phospholipases and there are some reports of coagulopathy [31], but these symptoms are rarely related to bleeding.
However, Rodríguez-Vargas et al. [82] demonstrated that the venoms of Micrurus helleri, M. medemi, and M. sangilensis contain significant percentages of metalloproteases (9.8-13.8%) in their proteome, along with marked enzymatic and protease activity. These findings have serious implications for public health and the clinical management of patients for the following reasons: (1) these snakes inhabit urban and peri-urban areas; (2) The neutralizing capacity of the antivenoms available on the market is limited; and (3) medical staff and SIVIGILA, who diagnose the cases and classify micruric envenoming, base their criteria on the absence or mild formation of edema, absence of hemorrhages, and absence or mild manifestation of coagulopathies. Therefore, we recommend that soon, significant efforts should be invested in characterizing the venoms of the remaining endemic species in Colombia, linking their proteomic profiles with the clinical signs observed in patients, as well as their geographical distribution, ecological, and phylogenetic signals.
Hydrophis platurus (yellowbelly sea snake) is the only sea snake present in Colombia. Across the epidemiological snakebite surveillance history, envenomation caused by this species has been controversial. According to the SIVIGILA dataset during the period 2010-2020 there were 65 cases reported of bites caused by this snake. Nevertheless, this information is not reliable because the geographical location of the bites did not correspond to the known distribution for this species and is probably the result of misidentification of the snake that caused the envenomation (See Chapter 1).
For example, 61 reported cases occurred in mainland localities within the Andes cordillera, or on the Caribbean coast, outside of the known historical range (See Chapter 1). Another four cases were reported from localities from the Pacific Ocean, that is the known distribution for this species, but the common name reported corresponds to common names for local pit vipers rather than the common sea snakes’ names. Also, the symptoms of these cases were local such as pain or edema, and there were no descriptions of any neurotoxic symptoms that would be is expected in an envenomation caused by sea snakes [32]. So, we conclude that during the period 2010-2020 in Colombia there are not official cases of envenomation caused by Hydrophis platurus. Nevertheless, there are historical records of envenomation caused by H. platurus in localities such as Guapí (mouth of the Guapí River, Cauca), Gorgona Island; Tumaco and El Charco, municipalities on the Pacific coast of Nariño [13,30,43].
2.2 Antivenom use, non-medical practices, and snakebite risk
Antivenom use
During the last decade snakebite cases with antivenom application exhibited significant differences between snake genera, as well as within the categories of envenomation severity by genus. The national toxicological guideline stated by the Colombian Health Ministry indicates the required antivenom dosage based on the snake’s genus, severity and antivenom manufacturer [35]. Despite this in all medically important genera considered on the national snakebite notification sheet, (Bothrops, Crotalus, Lachesis, Porthidum, and Micrurus) the number of envenomation cases without antivenom application was considerable (Table 9).
Table 9. Chi-square test evaluating the differences between snake genera, as well as withing categories of envenomation severity by genus.
|
Genus
|
Severity
|
Antivenom usage
No Yes
|
Chi-square
|
|
Bothrops
|
Mild
|
3,065
|
13,945
|
585.9, df = 2, p < 0.0001
|
|
Moderate
|
946
|
10,261
|
|
Severe
|
206
|
2,238
|
|
Crotalus
|
Mild
|
230
|
540
|
19.793, df = 2, p <0.0001
|
|
Moderate
|
100
|
367
|
|
Severe
|
11
|
78
|
|
Lachesis
|
Mild
|
33
|
103
|
7.89, df = 2, p < 0.019
|
|
Moderate
|
9
|
64
|
|
Severe
|
4
|
42
|
|
Porthidium
|
Mild
|
575
|
1,649
|
13.58, df = 2, p < 0.001
|
|
Moderate
|
174
|
689
|
|
Severe
|
9
|
50
|
|
Micrurus
|
Mild
|
179
|
204
|
12, df = 2, p < 0.0018
|
|
Moderate
|
51
|
107
|
|
Severe
|
20
|
44
|
df= degrees of freedom; p = probability under the assumption of no effect or no difference.
This demonstrates that medical practitioners have been avoiding the use of antivenom therapy when the patients are classified as mildly envenomation. In contrast, a significantly high number of cases with antivenom application was observed in moderate and severe bothropic envenomation, as well as severe lachesic envenomation (Figure 9). Envenomation caused by Porthidium species, considered, and treated clinically as bothropic envenomation, exhibited a significantly high number of cases with antivenom application when the patient was classified as mildly envenomation, but significantly low when the patient was classified as moderately or severely envenomation. Similarly, most micruric envenomations are only treated with antivenom when patients are classified as moderately or severely envenomation. Nevertheless, in micruric snakebites the data provided by SIVIGILA does not allow an accurate association between envenomation severity and the treatment applied, and the incidence output (alive/death patient).
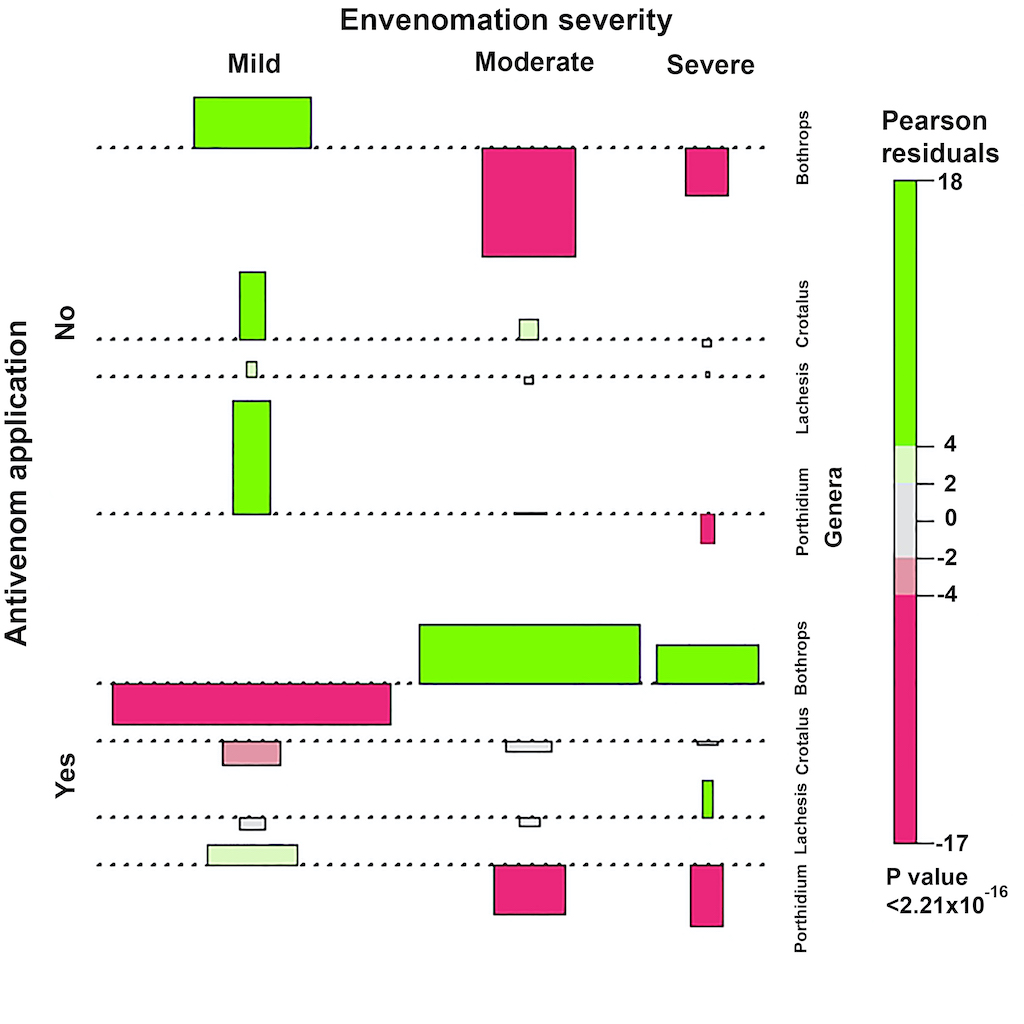
Figure 9. Chi-square for polytomous variables .Plot depicting the differences between snake genera, as well as withing categories of envenomation severity by genus.
Non-medical practices for snakebite that are used in Colombia
Most of the non-medical practices occur in bothropic, crotalic, and lachesic envenomation, and the cases are significantly high in bothropic envenomation that is categorized as moderate and severe (Table 10). Particularly, prayers and sucking are significantly high in bothropic envenomation in all severities, while herbal poultices and potions are significantly high in moderate and severe envenomation. The number of bothropic envenomation cases without non-medical practices was significantly low. There were no significant differences between non-medical practices in crotalic, lachesic and micruric envenomation for patients categorized in any envenomation category. In contrast, envenomation caused by Porthidium specieshas a significantly high number of cases with non-medical practices for all envenomation categories.
Non-medical practices are common for snakebites caused by pitviper species, but these practices are particularly frequent among Colombian patients that suffer bothropic envenomation, representing 21% of total reported cases. Non-medical practices such as the use of potions (30%), herbal poultices (24%), magic blessing or prayers (22%) represent the most frequent practices, which agrees with literature [36–39]. Most of these practices have been described as controversial, ineffective, or dangerous because traditional treatments performed by shamans and healers have been shown to be inadequate for combating the envenomation caused by Bothrops snake species [40–42]. Particularly, non-medical practices have been contraindicated because these delay in time before receiving suitable treatment for the patient, as well as an antivenom therapy that will reduce the clinical complications and possible sequelae [35,43].
Nevertheless, in most cases due to a lack accessibility of medical assistance in rural areas, shamans and healers are the first responders. Despite traditional medicines or first aid practices not having direct effects on envenomation caused by snakebites [38], there is little research proving claimed clinical efficacy of traditional medicines and practices with respect to physical symptoms like pain, edema, erythema, nausea, paresthesia, blurry vision, body aches, headaches, weakness, and tiredness the body. Also, there is little evidence supporting the effect of these practices on physical or psychological symptoms such as post-traumatic stress disorder and depressive disorder [44–49]. More research must be done to generate evidence about the effectiveness and possible use of traditional medicine to deal with snakebite envenomation, but nowadays the only supported treatment is still antivenom administration.
Table 10. Non-medical practices against snakebite used in Colombia by envenomation severity.
|
Genus
|
Severity
|
Herbal
poultices
|
Potions
|
Magic blessing or Prayers
|
Suction
|
Other
|
Chi-square
|
|
Bothrops
|
Mild
|
1,076
|
1,361
|
1,062
|
152
|
1,252
|
105.1, df = 8; p < 0.0001
|
|
Moderate
|
916
|
1125
|
841
|
95
|
725
|
|
Severe
|
266
|
351
|
294
|
20
|
150
|
|
Crotalus
|
Mild
|
47
|
75
|
48
|
16
|
42
|
10.63, df =8; p = 0.22
|
|
Moderate
|
40
|
54
|
28
|
5
|
34
|
|
Severe
|
8
|
7
|
10
|
0
|
4
|
|
Lachesis
|
Mild
|
8
|
9
|
5
|
1
|
13
|
5.79, df =8; p = 0.67
|
|
Moderate
|
3
|
6
|
4
|
1
|
4
|
|
Severe
|
3
|
11
|
6
|
0
|
6
|
|
Porthidium
|
Mild
|
191
|
273
|
104
|
14
|
142
|
37.4, df =10; p<0.0001
|
|
Moderate
|
105
|
122
|
48
|
15
|
66
|
|
Severe
|
9
|
7
|
6
|
2
|
3
|
|
Micrurus
|
Mild
|
9
|
241
|
20
|
6
|
25
|
6.21, df =8; p = 0.62
|
|
Moderate
|
6
|
10
|
12
|
1
|
9
|
|
Severe
|
5
|
4
|
5
|
0
|
5
|
Chi-square tests depicting the differences between envenomation severity per genus. df= degrees of freedom; p = probability under the assumption of no effect or no difference.
Survival probability during bothropic envenomation
Commonly, snakebites in rural and peri-urban areas are seen as a death sentence. Since bothropic envenomation represents ~62% of Colombian cases, the estimation of the survival probability during a bothropic envenomation provides a useful approach for understanding the explanatory variables of the risk of death due to bothropic envenomation. We performed a logistic regression based on the bothropic envenomation dataset (2010-2020) provided by SIVIGILA (see appendix A for details). The logistic model correctly predicts 97.9% of all snakebite cases caused by Colombian pitvipers and, more important, it was able to correctly predict 99.9% of the cases in which the patient survives. The most relevant explanatories variables that works as survival predictors facing a snakebite by Colombian pitvipers are age (p < 0.0001), severity (p < 0.0001), antivenom application (p < 0.0001), systemic symptoms (p < 0.0001), local symptoms (p = 0.04), gender (p = 0.01), and non-medical practices ( p= 0.01).
In addition, according to the classification and regression tree model the most important variables for predicting the outcome of a snakebite caused by pitvipers is snakebite severity, followed by antivenom use, age, non-medical practices, systemic symptoms, and gender (Figure 10). Both models highlight the paramount importance of the correct medical diagnosis of the snakebite and antivenom application to increase the patient survival probability. Likewise, the models showed how performing non-medical practices decrease survival probability of the patient, reinforcing that traditional medicines and practices must be contraindicated. Besides, gender and age are determinant indicators of patient survival when antivenom application and non-medical practice were or were not performed.
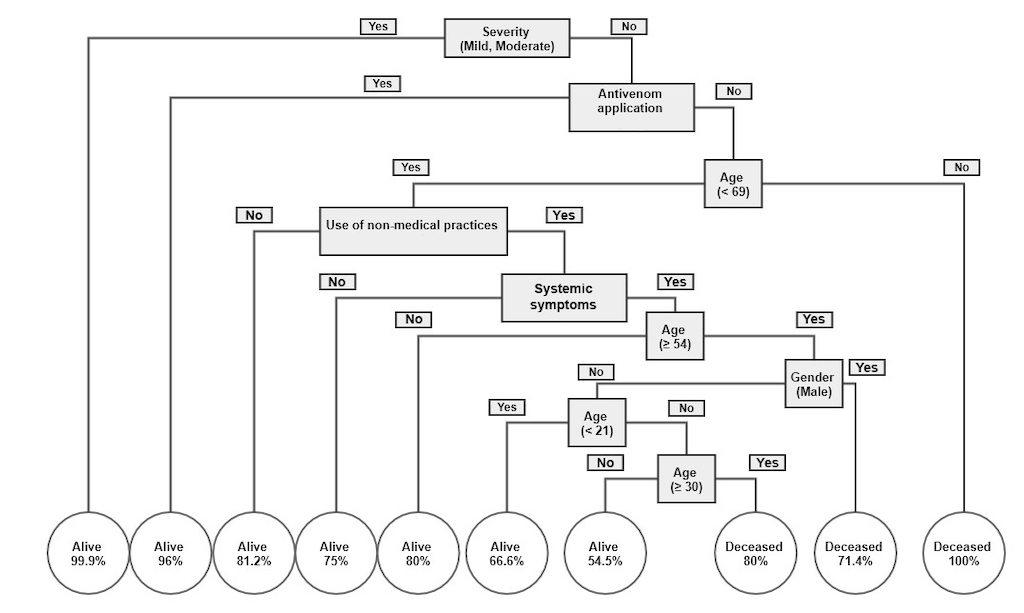
Figure 10. Classification and regression tree model depicting the survival probability of patients after a bite by a Colombian pit viper. Double negatives produce an affirmative response [e.g., Systemic symptoms (No)+logical branch (No) = Systemic symptoms were observed (Yes)].
Snakebite mortality
Between 2010 and 2020 snakebite mortality showed a decreasing trend, where minimum mortality occurred in 2019 and maximum mortality in 2020, and an average of 0.07 per capita deaths. Furthermore, during this period the asymmetry coefficient was -0.21; showing a kurtosis of -0.88, and a variation coefficient of 17.34% indicating that the dynamics behind the mortality trend are far from stable. During the years 2013, 2019, and 2020 the deaths caused by snakebites showed extreme rates outside of the confidence intervals (Figure 11A). The atypical behavior during 2020 may be related to COVID-19 pandemic and lockdown. This unfortunate event caused the Colombian health system to collapse, limiting its capacity to surveil snakebites in the country. In contrast, extreme mortality rates observed in 2013 and 2019 need further research to explore the possible factors behind the strong variability reported.
Mortality in urban and rural settings exhibited strong scale differences being highest in rural settings, representing about 70%-80% of total per capital deaths caused by snakebites in the country (Figure 11B). This was an expected result given the known worldwide pattern in which snakebite mortality is concentered in rural populations [11,42]. Likewise, rural populations showed a decreasing trend during the last decade while urban populations exhibited a steady trend (Figure 11B).
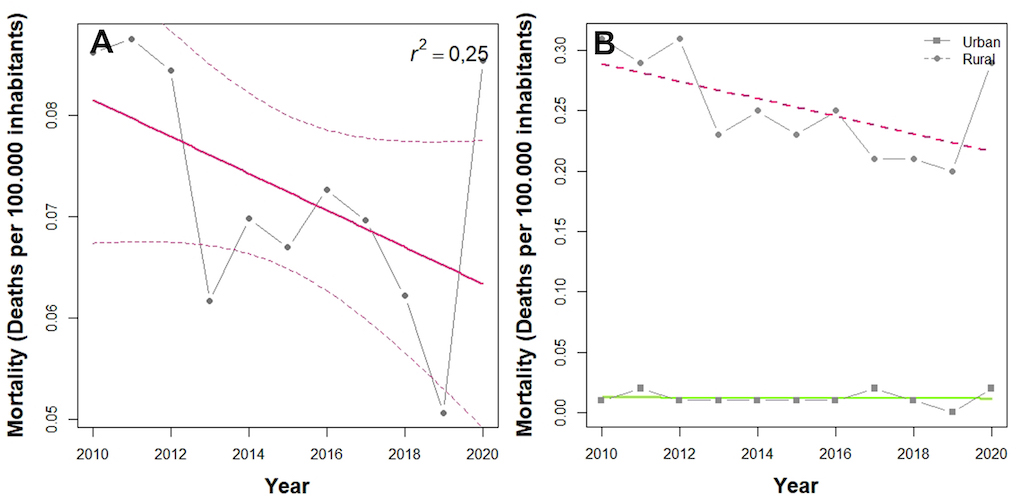
Figure 11. Snakebite mortality trends across the period 2010-2020 in Colombia. (A) Mortality rate. Solid line depicts linear regression model while dashed line confidence intervals of 95%. (B) Mortality rate split between urban and rural areas. Both solid and dashed lines depict the linear regression model.
During the last decade, the mean snakebite mortality rate in Colombia was 0.3 per capita deaths. Vaupés was the single department of the country that maintained its mortality rate above national-average throughout the decade (Figure 12A). Vaupés exhibited the highest record of snakebite mortality (8.8 per capita deaths) as well as the highest yearly variability, followed by Amazonas (4.5 per capita deaths), Guainia (4.2 per capita deaths), and Guaviare (2.7 per capita deaths) (Figure 12). In contrast, departments, or territorial units like Bogotá D.C., Quindío, Huila, Barranquilla, and Archipelago of San Andres and Providence have no reported deaths caused by snakebites during the same period. In conclusion, the mortality rate, considered along with the results of the snakebite incidence analysis described above (see section 1 of this chapter) show us that Colombian populations living in the cis-Andean region, in particular the Amazonian region, are the most at-risk for snakebite.
Since the cis-Andean region is the most affected area by incidence underreporting in the country [21], mortality reports also can be underestimated, further aggravating the truthfulness and accuracy of SIVIGILA. Thus, the Orinoco and Amazonian regions urgently require actions that reduce, mitigate, and prevent snakebite accidents, as well as a prioritization in the nation health plans and programs that focus on neglected tropical diseases.
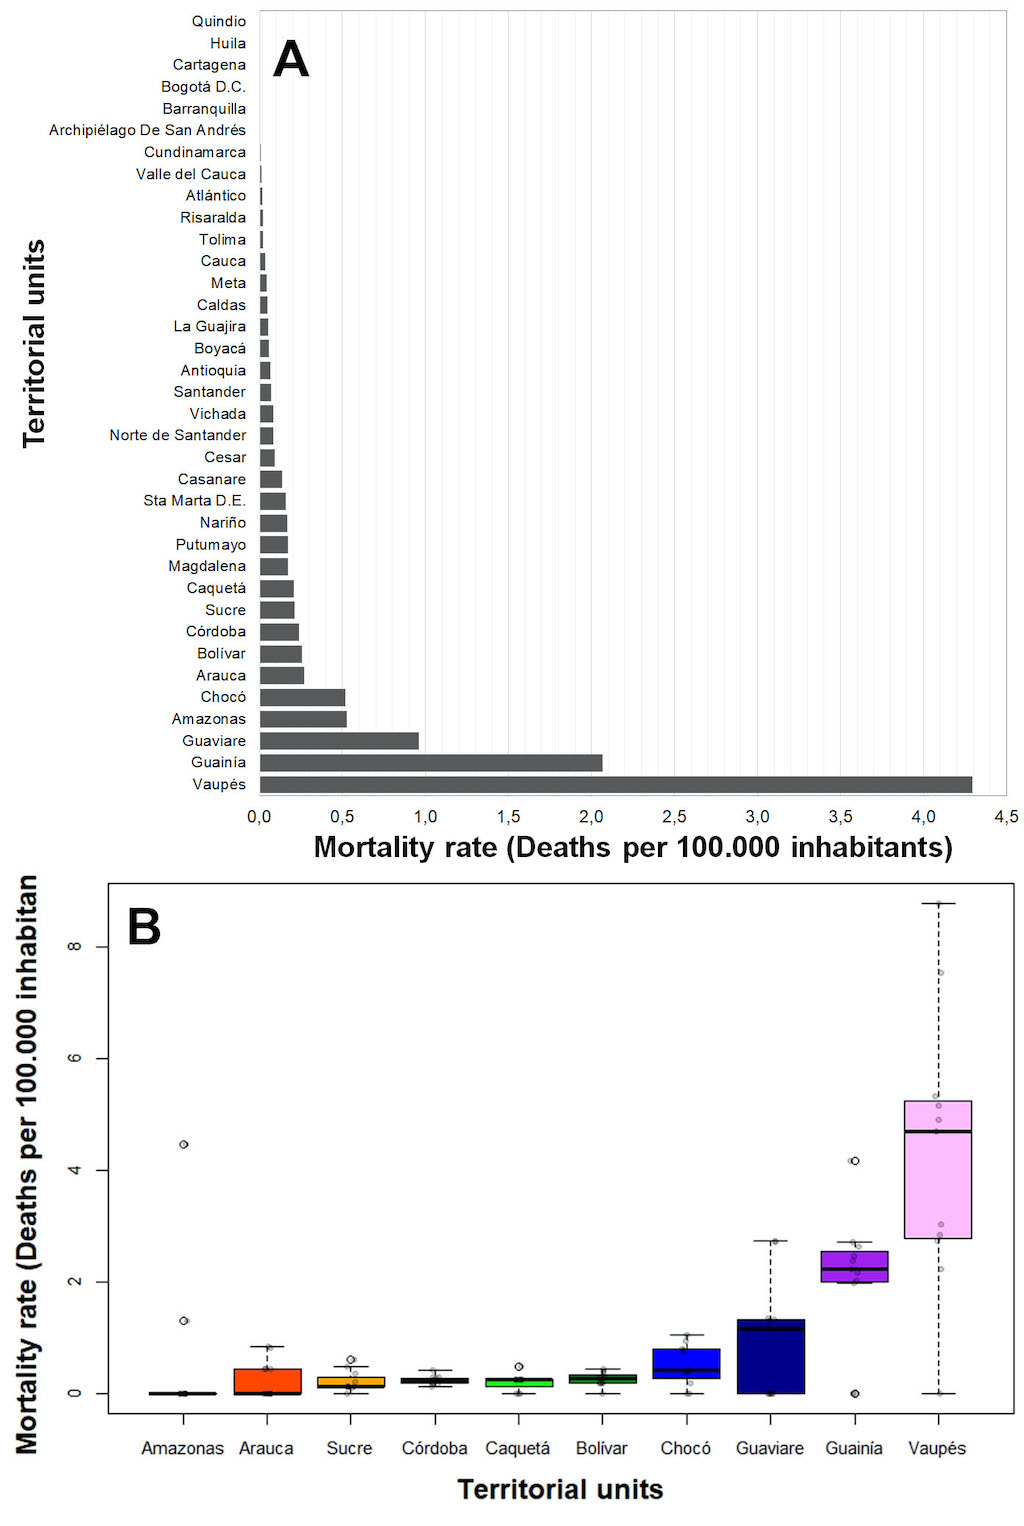
Figure 12. Mortality rate variability by territorial units. (A) Mean mortality rate by territorial units during 2010-2020. (B) Boxplot depicting the mortality rate variability of the ten territorial units with the highest mortality rates during 2010-2020.
Despite this unfortunate scenario, our results agree with previous studies that reported the same trends, annual averages, and variability of mortality rates, highlighting the low mortality in Colombia with respect to other countries of the region like Bolivia, Panama, Costa Rica, Nicaragua, Guyana, and French Guyana [1]. However, the trend observed during 2010-2020, including both total mortality rate and mortality rate differentiated by urban or rural areas, did not show a correlation with time (Fglobal= 2.947, df = 1-9, p = 0.12; Frural= 0.22, df = 1-9, p = 0.88; Furban= 4.70, df = 1-9, p = 0.06), indicating that the Colombian surveillance system has significant shortcomings for reporting the yearly per capita deaths caused by snakebites, probably due to underreporting (Figure 11B). Therefore, the SIVIGILA must invest significant efforts for enhancing the way that the system detects, and reports deaths caused by snakebite, as well as to boost the understanding of the factors behind the dynamics of underreporting.
Snakebite lethality
The snakebite lethality rate shows a decreasing trend across the decade. An average lethality of 0.73% per snakebite was reported for the last decade (Figure 13A), exhibiting a strongly scaled difference between urban and rural areas; the highest trend was found in rural areas and representing about 70%- 80% of total deaths due to reported snakebites (Figure 13B). However, when snakebite lethality rate is splitted between urban and rural areas, the tendencies showed opposite trends, showing an increase in reported lethality in urban areas and a decrease in rural areas (Figure 13B). Based on the data available, this contrasting behavior is difficult to explain, where most of it could be due to the underlying dynamics of underreporting that is poorly understood. Thus, readers must be cautious employing this result in an analysis or in decision making until a comparative analysis can be carried out, or other data can shed light on these trends. Similar to observations of snakebite mortality, neither urban nor rural snakebite lethality showed correlations with time, indicating significant shortcomings in the yearly report, possibly due underreporting (Fglobal= 20.38 df= 1-9, p= 0.18; Frural= 3.15 df= 1-9, p= 0.11; Furban= 0.4 df= 1-9, p= 0.83).
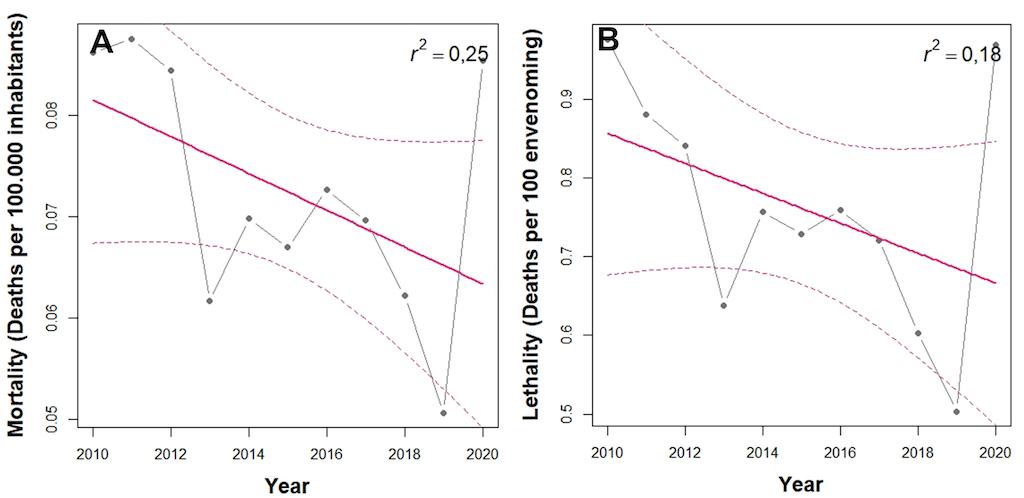
Figure 13. Snakebite lethality rate trends across the period 2010-2020 in Colombia. (A) Mortality rate. Solid line depicts linear regression model while dashed line shows confidence intervals of 95%. (B) Lethality rate. Both Solid and dashed lines depict the linear regression model
Among all territorial units only 20 of the 32 Colombian departments reported deaths from snakebite: Vaupes, Nariño, Santa Marta, Caldas, and Arauca were the top five territorial units with the highest snakebite lethality rate, ranging from 0% to 7,9% during 2010-2020. Once again, Vaupes department stands out as the riskiest in Colombia. Thus, urgent efforts must be made to reduce the incidence, mortality, and lethality in this department because this department is characterized by high poverty rates, and poor and absent roads, two of the main factors that increase the risk for snakebite. as well as its underreporting [21].
3. Clinical traits of snakebite in Colombia: learnings and future directions
Kasturiratne et al. [50] gathered global information from different countries governments, hospitals report, scientific papers, other sources of gray literature, and then they extrapolated the data. This research reported for the Americas an average of between 83,012 and 132,942 cases per year, with between 547 and 2,305 deaths each year using data from 1985 to 2007.
Recently, Chippaux [1] presented new data for the Americas by gathering information from the 20th century to the year 2016, retrieving information from scientific publications, governments, and hospital reports. He estimated an average of 57,500 cases each year with 370 yearly deaths, which is 30% less than the Kasturiratne et al. estimation [50]. Colombia had third place in the number of cases in the Americas (7.1%, N = 4,082), after Brazil (first place at 47.3%, N = 27,200) and the United States (second place at 8.7%, N = 5,000). Additionally, Colombia had fourth place in yearly deaths. with an average of 20.8 deaths per year, Brazil had first place (N = 145 deaths), then Mexico (N = 50), and third place was occupied by Bolivia (N = 40) [1].
According to SIVIGILA data, the lethality in Colombia for 2010-2020 was 0.73% (365 cases); 68% of these deaths (245 cases) corresponded to bothropic envenomations. The country's lethality has been significatively decreasing with respect to data collected between 1992 and 1998 by previous studies that reported a mortality rate of 5% [51]. This reduction in lethality may be related to the good reporting system, reliable national antivenom production, and higher territorial antivenom distribution (see Chapter 6). Reports of quality can be improved to enhance reliability and to obtain more epidemiological information relevant to a decrease in this lethality, which is aligned with the WHO strategy aiming to reduce snakebite mortality by 50% in 2030 [52].
Viperidaeis the family that causes most of the envenomation in South America, and species of Bothrops cause 80%–90% of total envenomations. Bothrops asper and B. atrox cause between 50% and 80% of the envenomations [29,53]. Until 2017, data from SIVIGILA showed a higher incidence from Bothrops species reaching 70-80% of total incidence, but after 2018 this percentage dropped to 62%, significantly lower than data reported until 2017 in Colombia, as well as in surrounding countries of the continent [54]. Interestingly, after 2018, 32% of the cases were caused by snakes in groups defined as “other species” or “species not identified”. The common name reported for 33% of the bites caused by these undefined groups correspond with family Viperidae. Furthermore, most of the clinical symptoms are compatible with the expected symptoms of envenomation caused by species from this family. Therefore, it is plausible that this drop in the incidence since 2018 was caused by some modifications done this year in the reporting sheet, as well as the low capacity of the medical practitioners for making suitable identification of venomous snakes.
Currently in the country, there are few practical tools and guidelines to face snakebite envenomation, as well as handbooks to help in the suitable identification of venomous snakes. However, those that exist have had low use [55]. This aspect must be improved by policies decisions and normative actions looking to improve snakebite epidemiological surveillance and knowledge of health personnel in this regard [52].
Common signs of envenomation
After envenomation caused by species of Viperidae,alterations caused by blood coagulation are the most common systemic alteration, and they are the main cause of death [56]. This venom action is called hemotoxicity, and it is explained by toxins affecting coagulation, fibrinolysis, vascular endothelium, and platelet dysfunction [54]. The effects eventually cause abnormal coagulation tests, hemorrhage of different organs and systems or both. The symptoms have been traditionally classified as disseminated intravascular coagulation (DIC), but recently this concept has been revised and redefined as venom-induced consumption coagulopathy (VICC). VICC may be present in 54% of the cases, and systemic bleeding in 15% [57].
Diagnosis of VICC is done by a demonstration of alterations in coagulation times by using activated partial thromboplastin time (aPTT), prothrombin time (PT), international normalized ratio (INR), the increase of D-dimer, and the decrease of fibrinogen and thrombocytopenia [57,58]. Unfortunately, SIVIGILA data cannot clarify the incidence of VICC because not all medical centers, especially those located in remote areas, can perform coagulation times tests, and this procedure is not requested in the SIVIGILA’s data collection form. As an alternative, the 20-min whole blood clotting test has been used globally to look for hemotoxic effects, diagnose VICC and to define the use of antivenom in countries or regions where routinely other kinds of coagulation tests are not available, and Colombia has not been the exception [58,59].
Acute kidney injury (AKI) is defined as an increase in serum creatinine ≥ 0.3 mg/dL (26.5 µmol/L) in 48 hours; the increase ≥ 1.5 times of its basal level in the last 7 days; or a urinary volume <0.5 mL/(Kg * h) for 6 hours [60]. The global estimation of AKI incidence varies between 8% and 60% of the patients, and this problem is called snakebite-associated acute kidney injury (SAKI). Of these cases, between 15% and 92% will require kidney replacement therapy. SAKI mortality is estimated at 45%, and 50% will develop chronic kidney disease (CKD) [61].
In South America SAKI occurs in between 1.4% and 38.5% of total cases, varying between species. Bothrops asper exhibitsthe highest value (38.5%), while B. atrox is at 6% [62]. Since the late 1990s, it has been proposed that kidney damage that develops from snake envenomation whose venom is hemotoxic is due to the formation and accumulation of fibrin microthrombi in the renal tubules (thrombotic microangiopathy - TMA). This condition has been defined as the presence of microangiopathic hemolytic anemia (MAHA), thrombocytopenia and AKI [63].
In Colombia, SIVIGILA data showed that the incidence of AKI during 2010-2020 is lower than reported in the previous studies [62], and the incidence of TMA is unknown. This may because: (1) TMA diagnostics are not being performed; (2) there is lack of knowledge in medical personnel; (3) there is difficulty in measuring creatinine and other laboratory parameters in remote hospitals or health centers; or (4) the data that define the diagnosis are not recorded in the SIVIGILA reporting form.
Strict quantification of urine volume as a guiding measure of the development of kidney failure, as well as a peripheral blood smear showing spherocytes and microschistocytes, and platelet count, are feasible in minimally complex hospitals and should be strictly done. Also, the data collection form must be adjusted so that this type of data can be recorded.
Data from studies in neighboring countries, with similar snakebite’ characteristics and clinical behavior, and data from previous reports for Colombia, found necrosis in 2% – 38.5% of cases [29,51], compartment syndrome in 6% – 7.7% [51,64]. Rhabdomyolysis in 31% [65], and the presence of cellulitis, fasciitis, and abscesses in 7% – 30.8% [29,51]. Another study found even higher incidences: abscesses (69.1%), necrotizing fasciitis (16.4%), and cellulitis (21.8%) [65]. The information obtained from SIVIGILA data are quite inferior when compared to what has been previously reported in the specialized literature.
For lachesic envenomation clinical effects are similar to bothropic envenomation, where the envenomation severity is mainly severe (60% of cases), and the mortality is close to 10% [22,66]. In addition, it has vagal symptoms such as bradycardia, profuse diarrhea, abdominal pain, and hypotension, where these symptoms are considered as manifestations of severe envenomation and can help differentiating between this envenomation and bothropic envenomation [67].
In Colombia there are scarce knowledge around lachesic envenomation because of the low incidence of snakebites caused by this genus. Even so, it is important to remark that 86% of patients under this envenomation presented epistaxis as a systemic manifestation of coagulopathy, while only 1.5 % of bothropic envenomation cases presented this manifestation, thus epistaxis can show the strong fibrinolytic effect of Lachesis venom [68].
Data used in this analysis contrasts with that previously reported in the literature since mortality was very low (1.5%), only 18% of the accidents were severe and vagal manifestations as a severe clinical picture were described in less than 5% of the cases [65,68]. Low mortality could be due to a greater availability of antivenom serum and the change in the country's political conditions that have allowed people to move more easily from remote areas to hospitals, since the data available for the country in the specialized literature, are from the last 20 years of the last century.
Compared to other genera of viperids, the venom of the South American rattlesnake (Crotalus durissus) has low capacity to produce edema and hemorrhage. However, rhabdomyolysis, secondary renal failure and neuromuscular paralysis are very characteristic findings [22,69]. A description of the incidence of the manifestations of this type of envenomation in Colombia was not found in the specialized literature, however, that between 27%-40% of severe crotalic envenomations develop ARF [22,69]. SIVIGILA data only reported 0.6%. The most frequent manifestations in crotalic envenomation were local, coinciding with reports on this type of envenoming in Brazil, where pain and edema occurred in 91% and 73% of the cases [69]. In addition, ecchymosis, blisters, and necrosis were reported in the SIVIGILA data, findings not previously described for South American crotalic envenomation, since their venom lacks a dermonecrotic effect [22], although this has been described for Central and North American rattlesnakes [70].
These findings open new questions and hypotheses to be tested in the future. For example, recently, Rodriguez-Vargas et al. [71] evaluated the biochemical and biological differences in the venom of C. durissus from three ecoregions of Colombia, showing a remarkable variability in the proportions, presence/absence of the main toxins, as well as in their biological activity’s intensity. Thus, this strong venom shows geographic variability that could explain the atypical reports of clinical manifestation in the SIVIGILA dataset.
Another hypothesis that could explain these findings is an erroneous identification of the snake by the patient or by a lack of knowledge or misidentification of clinical manifestations by the health personnel. Additionally, these described effects can be not previously described because of the low incidence of this event. In this analysis, neurological and hemorrhagic manifestations had a low incidence, when compared to what is described in the literature, where manifestations present in SIVIGILA’ data such as muscle weakness or neurotoxic facies, or hemorrhages were found in up to a quarter of the patients (24%) [69]. However, comprehensive studies will be required to link clinical manifestation and the remarkable geographic variability of toxins observed in Colombian C. durissus populations.
The venom of coralsnake species of the Micrurus genus is of the neurotoxic type. Its toxins affect the functioning of the neuromuscular junction both at the pre- and post-synaptic level. The incidence of this type of envenomation is very low [72], and what is known about the clinical behavior in our country and other regions of America has been obtained from the description of cases. The low incidence is related to the fact that these snakes are not aggressive, have small fangs, and produce and inject small amounts of venom (see Chapter 5 and 5), as well as being rarely encountered in the wild, thus encounters between coral snakes and humans are low [72] (see Chapter 1). The capacity to produce edema or proteolysis is minimal; this is why the local effects are very inconspicuous from the clinical point of view [22].
In this analysis pain (80.8%) and edema (58%) were the most common local symptoms and paresthesias were reported in 26%, while literature mentions that pain and paresthesias are the local symptoms that occur more frequently [72–74]. Systemic neurotoxicity manifestations were described in a small number of cases, muscle weakness in 13% of them, the other manifestations only occurred in less than 5% of all cases. Both in Colombia and in other countries, a higher incidence of systemic neurotoxicity has been reported (50-91%) [22,72].
According to the SIVIGILA data, manifestations such as gingivorrhagia, epistaxis, and blisters were found in a minimum percentage of cases (1%, 0.5% and 1.8%, respectively). However, in 131 cases classified as micruric envenomation, the reported common name of the snake corresponded to those used for species in Viperidae. Although coral snakes have phospholipases in their venom, and cases of coagulation and platelet alterations have been described in some cases of New World elapid bites [31], it is very rare that these alterations could be related to some degree or type of bleeding [31]. Nevertheless, recently Rodríguez-Vargas et al. [82] demonstrated that two Colombian endemic coral snake species (Micrurus medemi and M. sangilensis) have a considerable quantity of metalloproteinases in their venom composition. This finding raises serious implications in clinical manifestations of envenoming caused by coral snakes, pointing out that our understanding of snakebite envenomation, is far to be accomplished with sufficiency.
4. Conclusions
The reporting system and data recompilation by SIVIGILA has improved significantly over the last decades, and nowadays it is one of the strongest in South America. Our results show how this system has captured most expected snakebite cases (96%). This great effort done by the vigilance division of the National Institute of Health led us to reach all the conclusions presented in this chapter. SIVIGILA’ data show that 26,324 cases of envenomation were treated by antivenom (53.8 %), and a total of 3,195 (12.13%) patients showed adverse reactions to antivenom. Of these reactions, 51% (N = 1,612) were generalized and the rest were localized, and about 70% of these reactions were observed during bothropic envenomation.
Spatial analyses show how important it is to discriminate cases between urban and rural population. We found that variables explaining the spatial variation of incidence changed between the urban or rural settings. This is a crucial finding because it tells us that the dynamics of snakebite accidents differ depending on the spatial contexts in which they occur, so prevention and management strategies must be adjusted to this reality. Furthermore, we found that the spatial distribution of snakebite cases is an essential component for understanding the viability of this public health event, as well as its association with the environmental and social variables that explain it. In particular, the GWR models showed better predictive capacity (higher r² values) than the multiple linear models that considered the same set of explanatory variables. As expected, closer municipalities will share same snakebite dynamics, but our explanatory variables are not enough to capture all the spatial heterogeneity of the distribution of cases. It is necessary to find more variables that can explain this heterogeneity, and to start including variables related mechanistically to venomous snake abundance.
Snakebite incidence has temporal trends with seasonal biannual peaks that corresponds to rainfall seasons. This behavior occurs at a national scale, but at a finer scale it is not homogeneous. Rainfall could be acting as a limiting factor: rainfall only modulates snakebite incidence in areas with marked dry seasons such as the Orinoco basin and the Caribbean coast [3]. Sadly, natural history data for reproductive cycles of venomous snakes in Colombia don’t exist. Thus, it is difficult to attribute these behaviors to snakes’ phenology. On the other hand, we found an increase in the average of cases between 2018 and 2019, that may be caused by La Niña. This analysis should be done to understand the interannual variation of incidence. Similarly, the decrease of cases during 2019 could be caused by the COVID-19 pandemic. These analyses should be the next step to understand the temporal heterogeneity of snakebite incidence and to start generating monitoring and predicting tools that allow us to enhance the way as we confront this NTDS.
We found that the highest burden associated with snakebite envenomation occurs in the Orinoquia-Amazonian region of the country, and it affects mainly rural population. It is important to understand why this region shows this high burden, because it is remote and have high underreporting, thus its population is more vulnerable to this health problem [21]. Particularly, the departments of Vaupés, Amazonas, Guainía, Guaviare, Arauca, and Chocó should be prioritized for the formulation and implementation of prevention and mitigation strategies for snakebite accidents, because these are the regions of the country at the highest risk.
Mortality and lethality have been decaying, but lethality in urban population has been increasing. This must be understood because there should be a higher antivenom accessibility in urban areas. Another interesting result is that a correct determination of envenomation severity is crucial to reduce mortality caused by pitvipers’ snakebites, and in severe cases the absence of antivenom usage and the preference for non-medical practices are the main explicative variables of these fatalities. Finally, it is important to keep compilating data for years posterior to COVID-19 pandemic, because this unfortunate event affected snakebite dynamics and reporting system, thus generating atypical data that can bias our presented analysis.
We want to offer some recommendations after writing this chapter that we hope will help to exploit all the potential that our reporting system offers.
First, the mandatory form to report snakebite should be simplified. There should be specific boxes for each symptom, thus data can be homogenized between different hospitals. Secondly, the current form doesn’t allow a correct classification of the severity of envenomation because the present frequency of severe and local symptoms is low compared to similar countries. Capacitation for medical practitioners on snakebite symptom diagnosis, characteristics, and treatment is fundamental. Furthermore, the increase in reporting quality will strengthen SIVIGILA reporting system and will enhance our knowledge of the geographic distribution of these clinical manifestations. The snakebite accident reporting form should be able to be filled out online or on a web platform that centralizes the data, allowing for better surveillance and monitoring of the event, reducing information duplication, speeding up administrative management, and ensuring traceability.
Another paramount issue is the detailed information on the times between envenomation, medical attention, and antivenom administration. We could not determine times between the bite and antivenom administration because the data is not accurate, or it is deeply incomplete. There are spaces for different digits in the format, but there is no concise organization of the units of these digits. Thus, information is just a number, and it is impossible to know if it relates to days, hours, or minutes. It is necessary to homogenize the scales of time for each one of the cells in the form to perform detailed analysis of severity, symptoms, and time to antivenom administration. Finally, the 20-min whole blood clotting test should be a mandatory test to determine VICC, which will help determining the family of snake that caused the envenomation. This would reduce the high number of unidentified cases, and it will help to determine which kind of antivenom should be used.
After characterizing the behavior of envenomation symptoms of venomous snakes in the country, we found that it is substantially different from that previously described for Colombia and neighboring countries. This highlights the need for correct capacitation of medical practitioners to determine symptoms and the correct identification of venomous snake’ that caused the envenomation. It is also important to start homogenizing the common English and Spanish names of venomous snakes to compile a central database that can overcome detected limitations. This training can help to improve surveillance, that will help to detail the causes and consequences of snakebites in the country to implement strategies proposed by the World Health Organization to reduce snakebite mortality by 50% [52].
Appendix A: Material and Methods
Mathematical models
We retrieved 19 bioclimatic variables for the country at a resolution of around 1 km x 1 km from the worldclim server (https://worldclim.org/[75]). Afterwards, we removed collinear variables by using a Pearson correlation cutoff of 0.8 to select independent layers. We did this reduction by using the package virtual species in the R environment [76]. We selected eight variables: temperature (B1), mean diurnal temperature range (B2), temperature seasonality (B4), temperature annual range (B7), precipitation (B12), precipitation seasonality (B15), precipitation of warmest quarter (B18), and precipitation of coldest quarter (B19). Then we computed the average value for each municipality of the country.
We extracted discriminated data for total, urban, and rural population and poverty (NBI) estimates at municipality scale from the national statistics department DANE, and we used the average value from 2010 to 2020 because this timespan corresponds with the national surveillance system (SIVIGILA) data coverage. We used human footprint maps for 2009 obtained from (https://wcshumanfootprint.org/[77], and we computed its average value for each municipality. Finally, SIVIGILA reported data corresponding to the national mandatory reports of snakebite from 2010 to 2020.
We performed the geographical weighted regressions (GWR) in the R environment by using the GWmodel package [78]. This package allows comparison between the spatial-structured linear model and a null classic linear model without this spatial structure. We first computed the bandwidth for the geographic structure by using an adaptive gaussian kernel, based on an Akaike information criterion (AIC) approach that selects the bandwidth that minimizes this value. Afterwards, we computed all possible models resulting from combining the defined independent variables (We used total population and NBI for total incidence, urban population, and NBI for urban incidence, and the same for rural areas); and we selected the model with the lowest AIC. Finally, we determined significant areas for each GWR coefficient by defining a significance threshold of 0.05.
Antivenom use, non-medical practices, and snakebite risk analyses
We evaluated the differences of the envenomation severity among the snake genera, and the differences in the non-medical practices against snakebite used in Colombia using Pearson's Chi-square for polytomous variables and the G-test of likelihood ratio.
We employed a logistic regression model to estimate the survival probability of patients after a snakebite. Based on the bothropic envenomation dataset (2010-2020) provided by SIVIGILA, we used the snakebite outcome codified as alive/deceased as dependent variable. We hypothesized as explanatory variables for the occurrence of the alive/deceased outcome after a bite by viperid snakes using the following features of the snakebite records: gender, age, hospitalization, initial non-medical treatment, non-medical practice, bite site, snake genus, local envenomation symptoms, systemic envenomation symptoms, and snakebite severity (Table 5). The dataset of snakebites by Colombian pitvipers encompasses a total of 32,918 records, however, after missing data depuration, we employed a subset of 16,495 records to perform all statistical analyses.
Before running the model, we tested multicollinearity between the different independent variables throughout inflation factors of the variance (VIF) to select uncorrelated variables, employing a cut-off value of 10. Afterwards, we performed a stepwise regression to eliminate those variables that were not significant using the Akaike information criterion (AIC) to define which were the variables to exclude. Finally, variables such as hospitalization, initial non-medical treatment, snake genus, and bite site were excluded by the VIF and AIC; and we used the logistic regression model using the remaining variables selected.
Additionally, we performed a classification and regression tree model to identify independent variables with the greatest power of discrimination, allowing an estimation of the survival probability of a patient after a bite by Colombian pit viper snakes. The tree was built employing five observations by partition and terminal node, as well as a pruning complexity of 0.0001. All statistical analyses were performed using the software Rwizard 4.3 [6] and the R packages rpart [79], stat [80], and MASS [81].
Table S1. Coding of the independent explanatory variables used in the logistic regression model and Classification and regression tree model.
|
Variable
|
Coding
|
|
Gender
|
Male / Female
|
|
Age
|
Age in years
|
|
Hospitalization
|
Yes / No
|
|
Initial non-medical treatment
(Bleeding, limb immobilization, mechanic suction, patient immobilization, Puncture, tourniquet, other)
|
Yes / No
|
|
Non-medical practice
(Herbal poultices, potions, prayers, sucking, other)
|
Yes / No
|
|
Bite site
|
Abdomen, back, toes and fingers, genitals, gluteus, head, lower limbs, upper limbs, neck, thorax.
|
|
Snake genus
|
Bothrops /
Crotalus / Lachesis /
Porthidium
|
|
Local envenomation symptoms
|
Yes / No
|
|
Systemic envenomation symptoms
|
Yes / No
|
|
Snakebite severity
|
Mild / Moderate / Severe
|
Appendix B
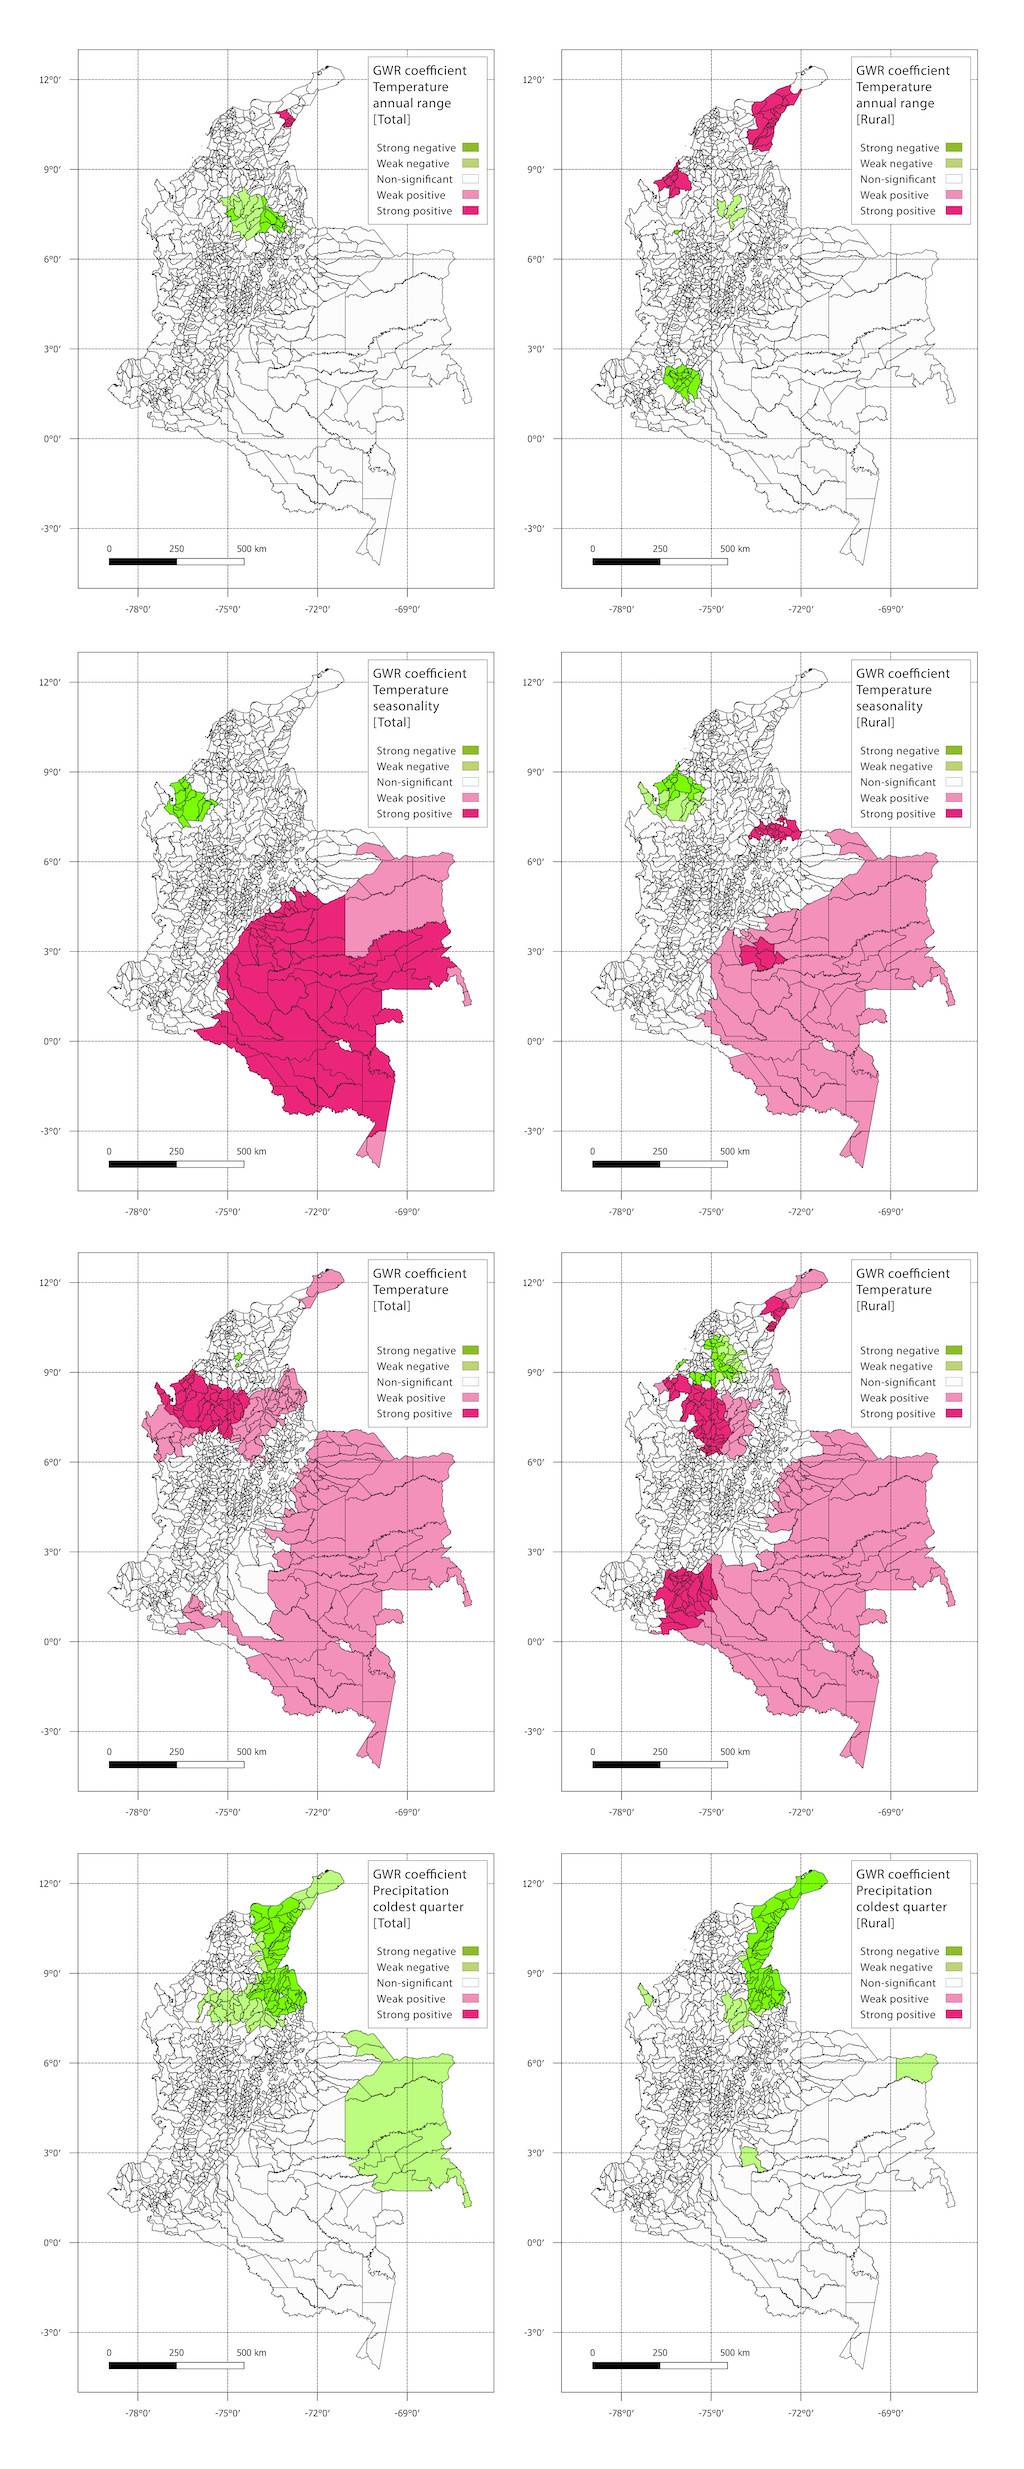
Figure S1. GWR coefficients for variables shared between total and rural areas.
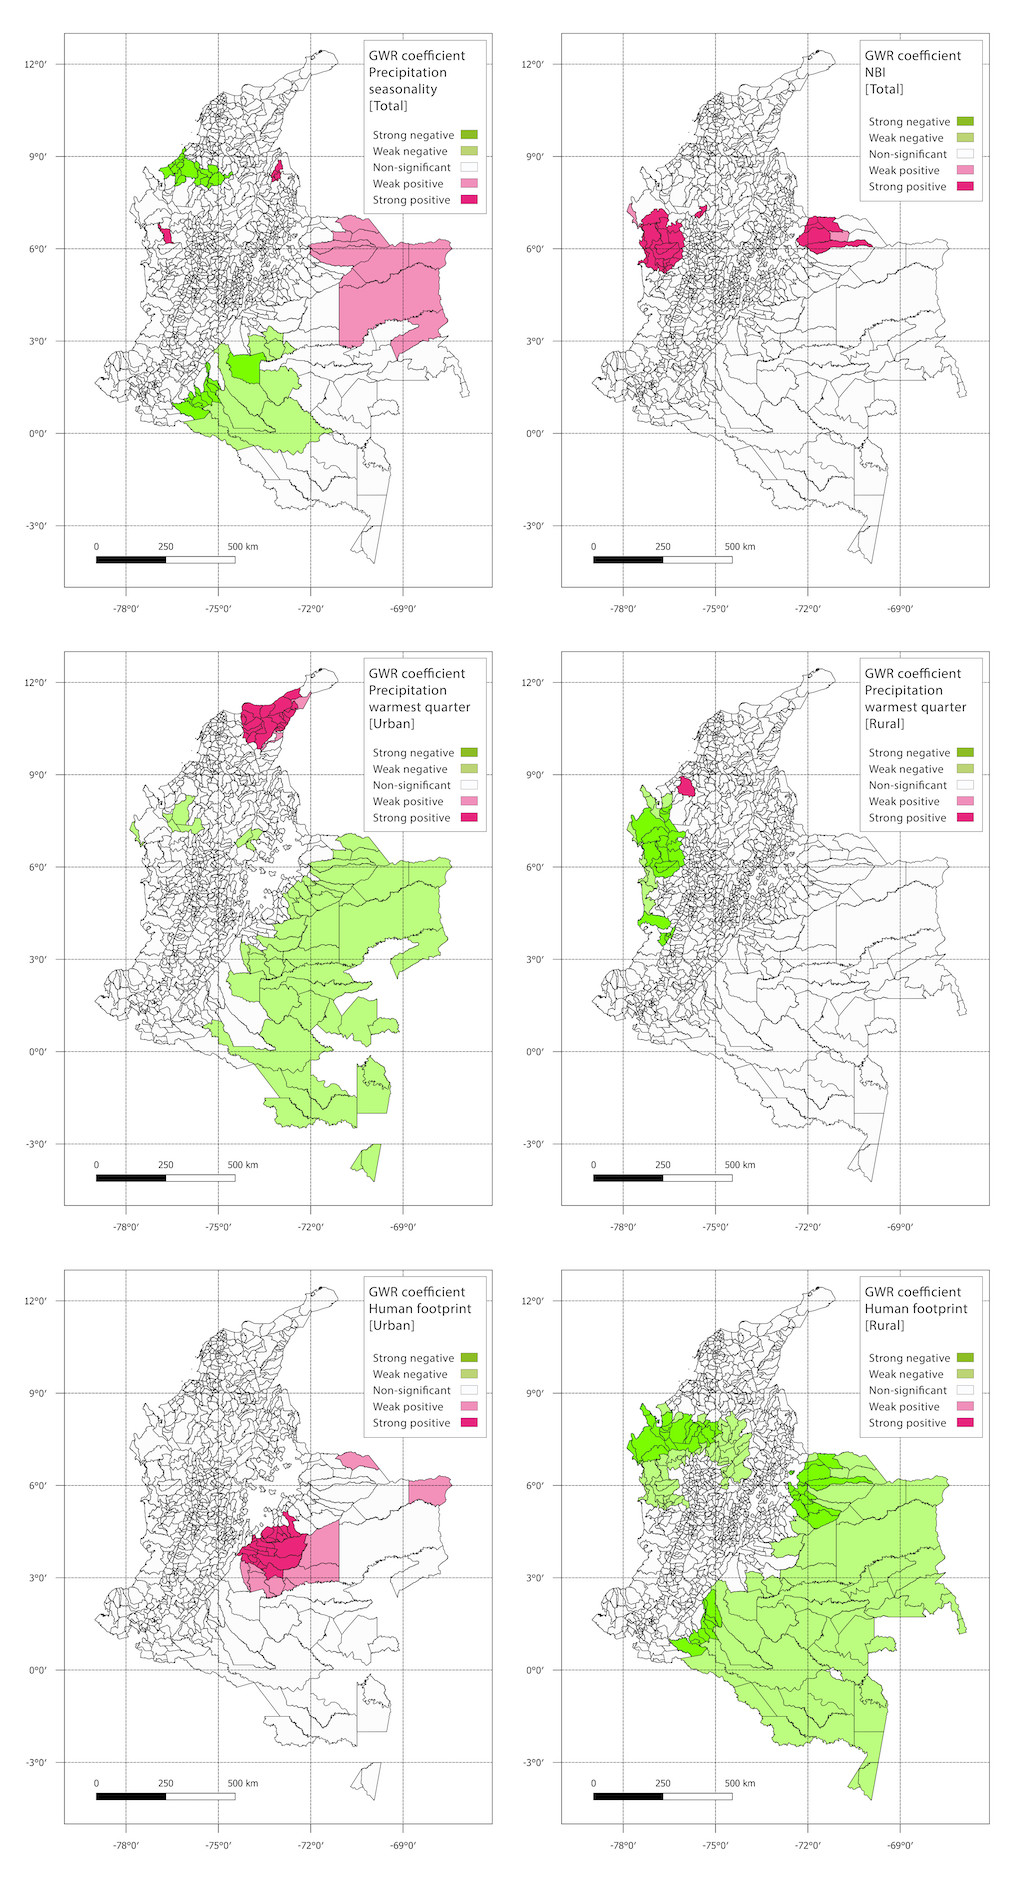
Figure S2. GWR coefficients spatial distribution of two variables only present in urban areas and variables shared between urban and rural areas.
.jpg)
Figure S3. Spatial distribution of snakebite cases